






Volatility in stocks Does that indicate a rising dollar ahead
Any catalyst that causes stocks to move lower, should cause the DXY to move higher.
Share this:

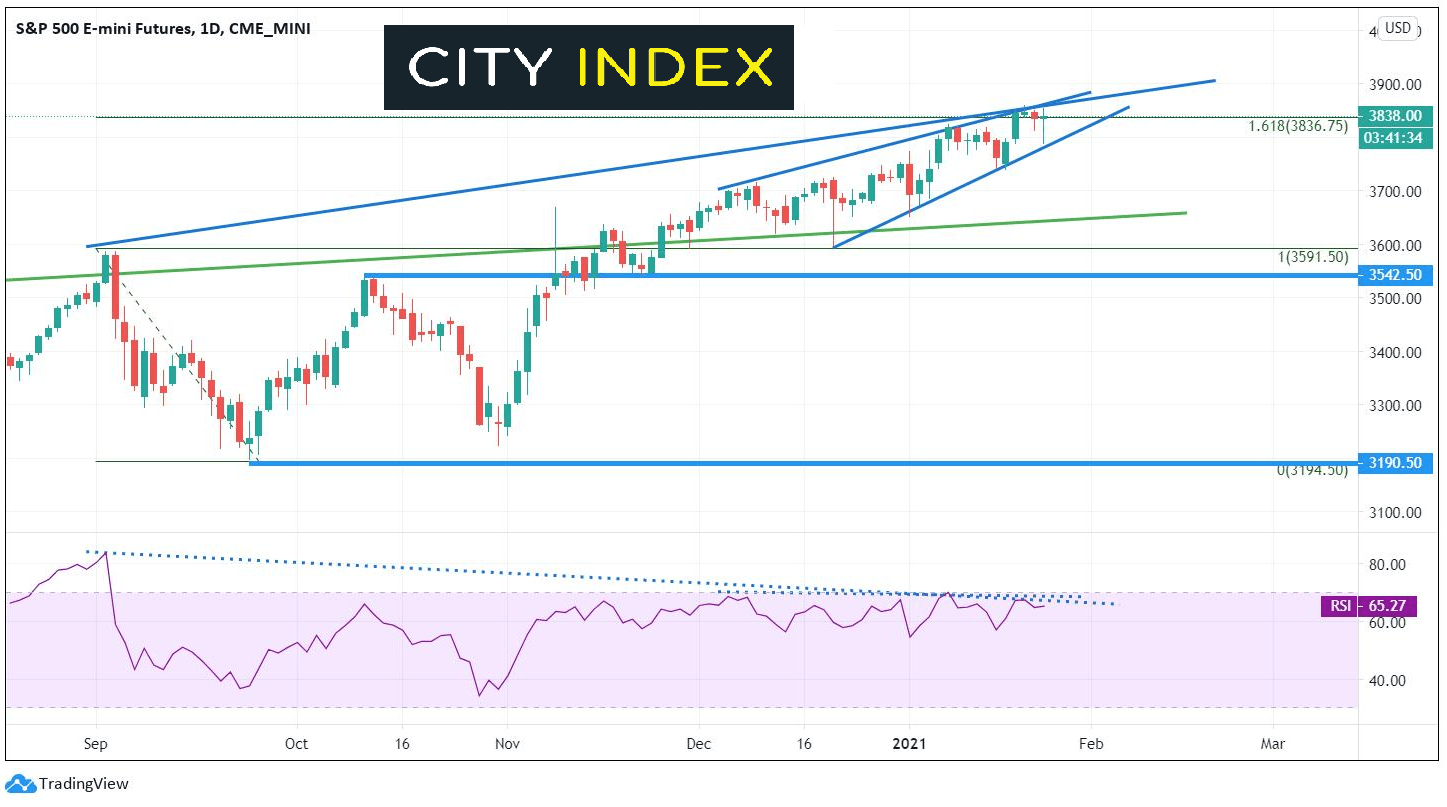
On a daily timeframe, the S&P 500 has moved to a level where it is decision time for traders. The index is currently at the 161.8% Fibonacci extension from the highs on September 2nd, 2020 to the lows on September 24th, 2020. In addition, price is pushing up against the trendline dating back to September 2nd. The stock index is also near the apex of an ascending triangle. The RSI is diverging with price. Some stocks, such as BBBY and GME, have gotten the snot squeezed out of them. Volatility was wild today, as the S&P 500 traded from 3853.25 down to 3788.50 in just under ½ hour, and by mid-afternoon, was back to positive.
Source: Tradingview, CME, City Index
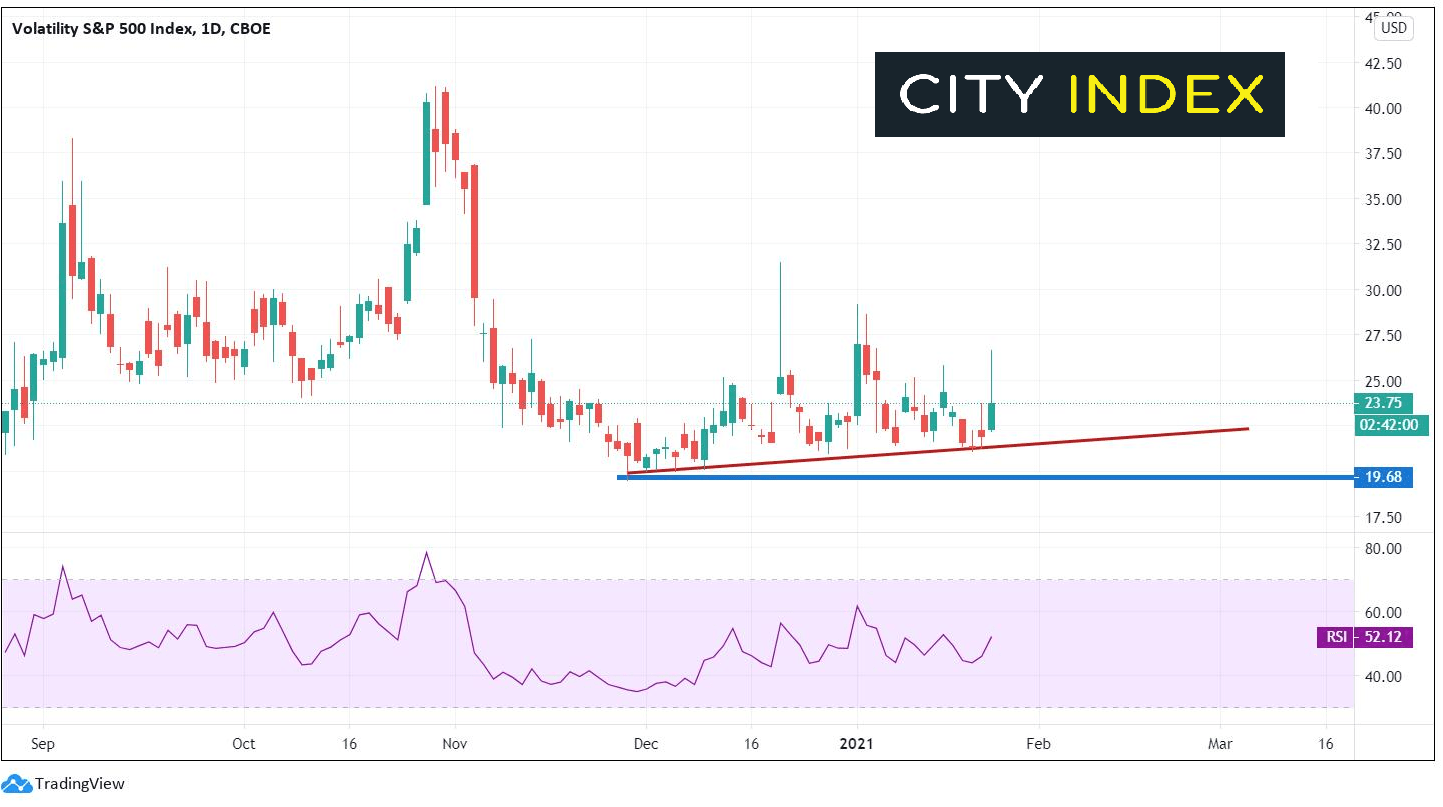
The Volatility S&P 500 Index (VIX) may be warning us of something. As the S&P 500 continued to put in higher highs, in December 2020, the VIX began putting in a series of higher lows! This indicates that traders are buying insurance against stocks in case of a risk-off move.
Source: Tradingview, CBOE, City Index
Does this indicate there is more volatility or even a pullback in stocks ahead? And if so, what does that mean for the US Dollar?
What could cause a pullback in stocks this week?
- A more hawkish Powell
- A higher core PCE (the Fed watches this to gauge inflation)
- Fears of a lower economic stimulus package than the $1.9 trillion Biden proposed
- Fears of “looking ahead” to tapering
- Problems with vaccine rollout
Anything can be a catalyst. As traders, we must determine what to do when, and if, stocks move lower. If stocks move lower for one of the above reasons, it will likely mean a US Dollar move higher.
DXY
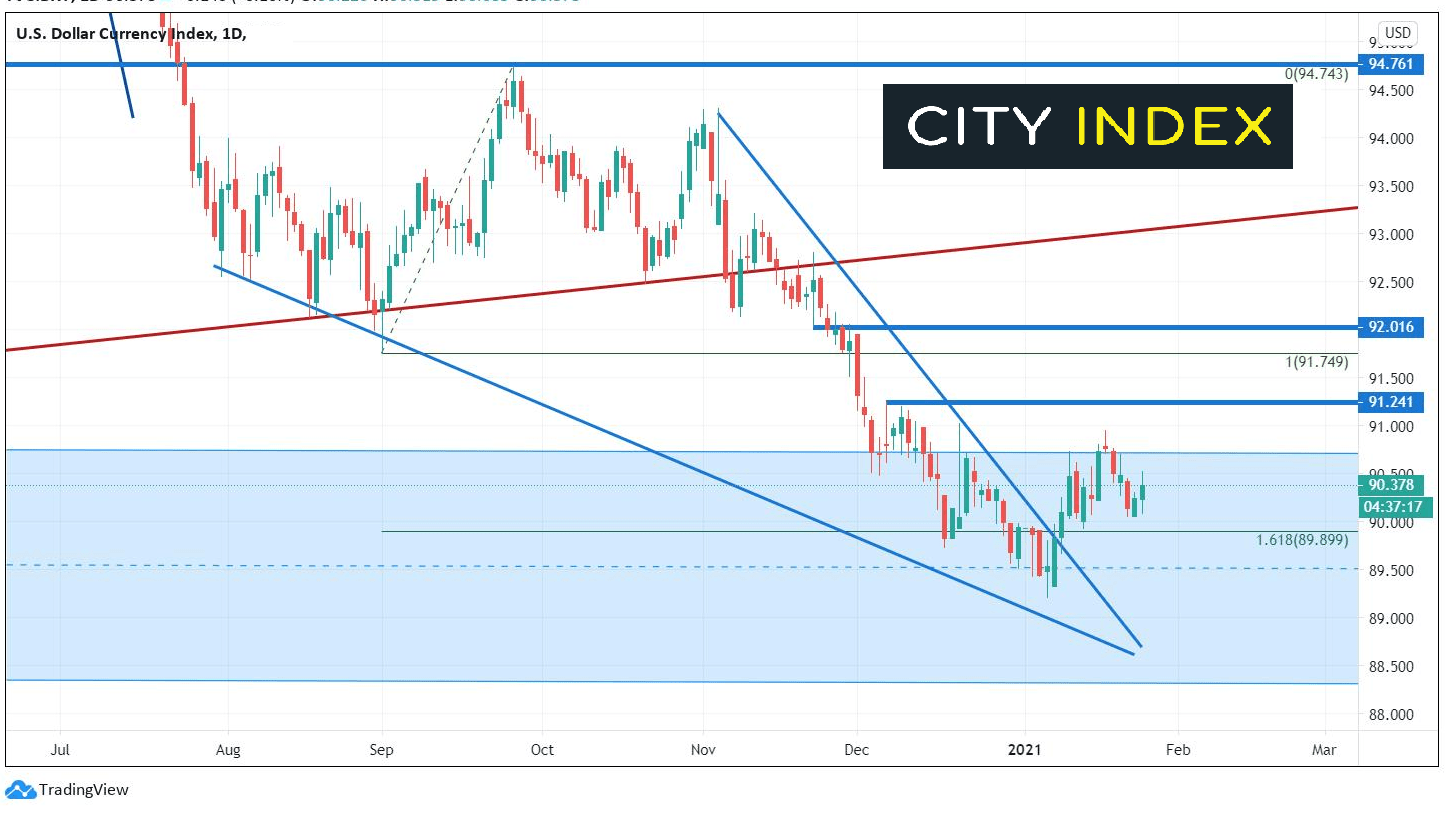
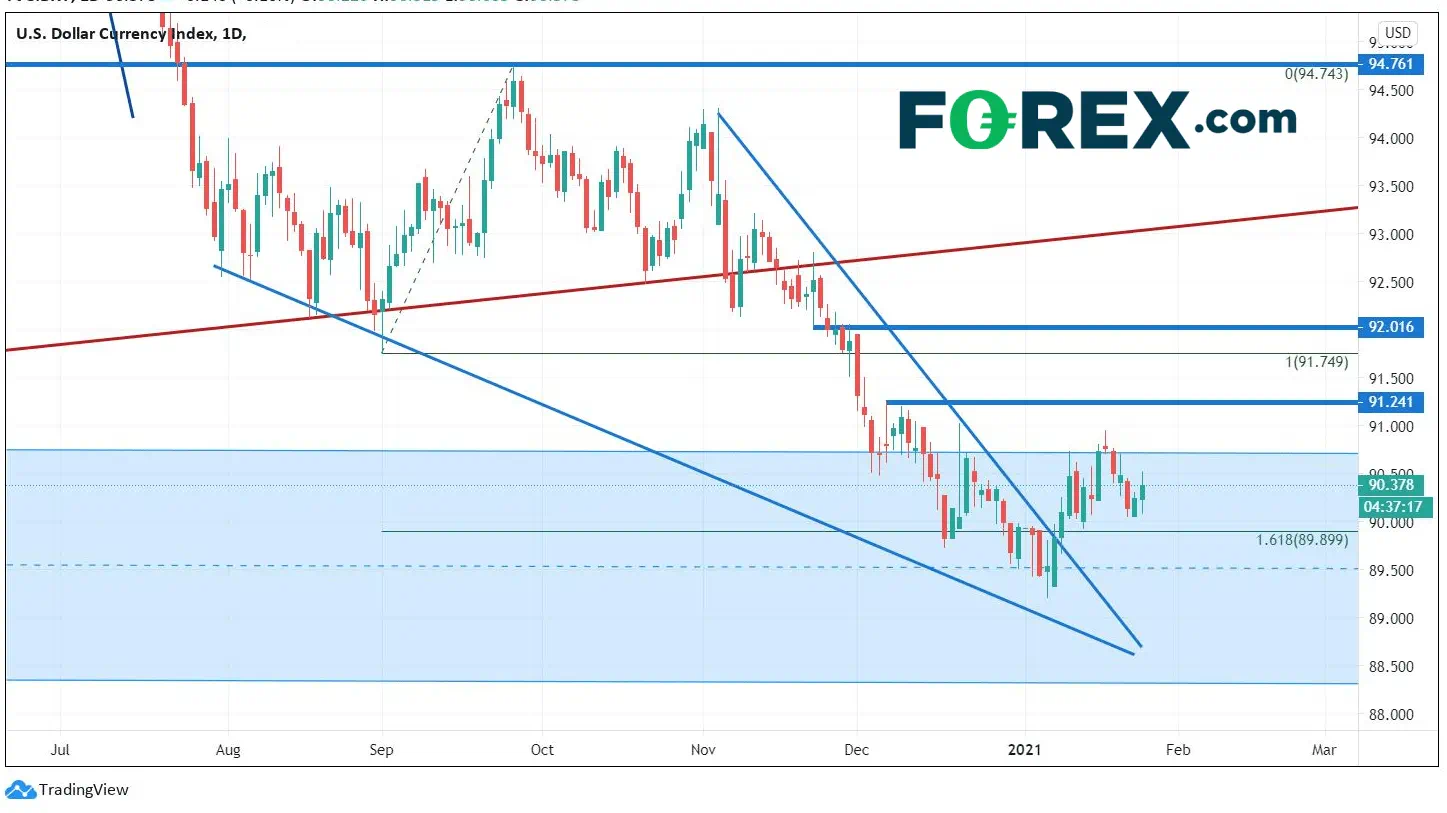
The US Dollar Index (DXY) has not done much over the past month. The index moved lower into a support zone (blue) and has been trading in that zone since. The DXY has been oscillating around the 161.8% Fibonacci retracement level of the lows of September 1st to the highs on September 25th. However, by moving sideways, it did manage to move out of a descending wedge. If stocks move lower, DXY should move higher, above recent highs at 90.95. A complete retracement of the wedge is at 94.30, but that is a way off. Near term horizontal resistance before this is at 91.24, 91.75 and 92.01.
Source: Tradingview, City Index
For insight on EUR/USD, see the Currency pair of the week.
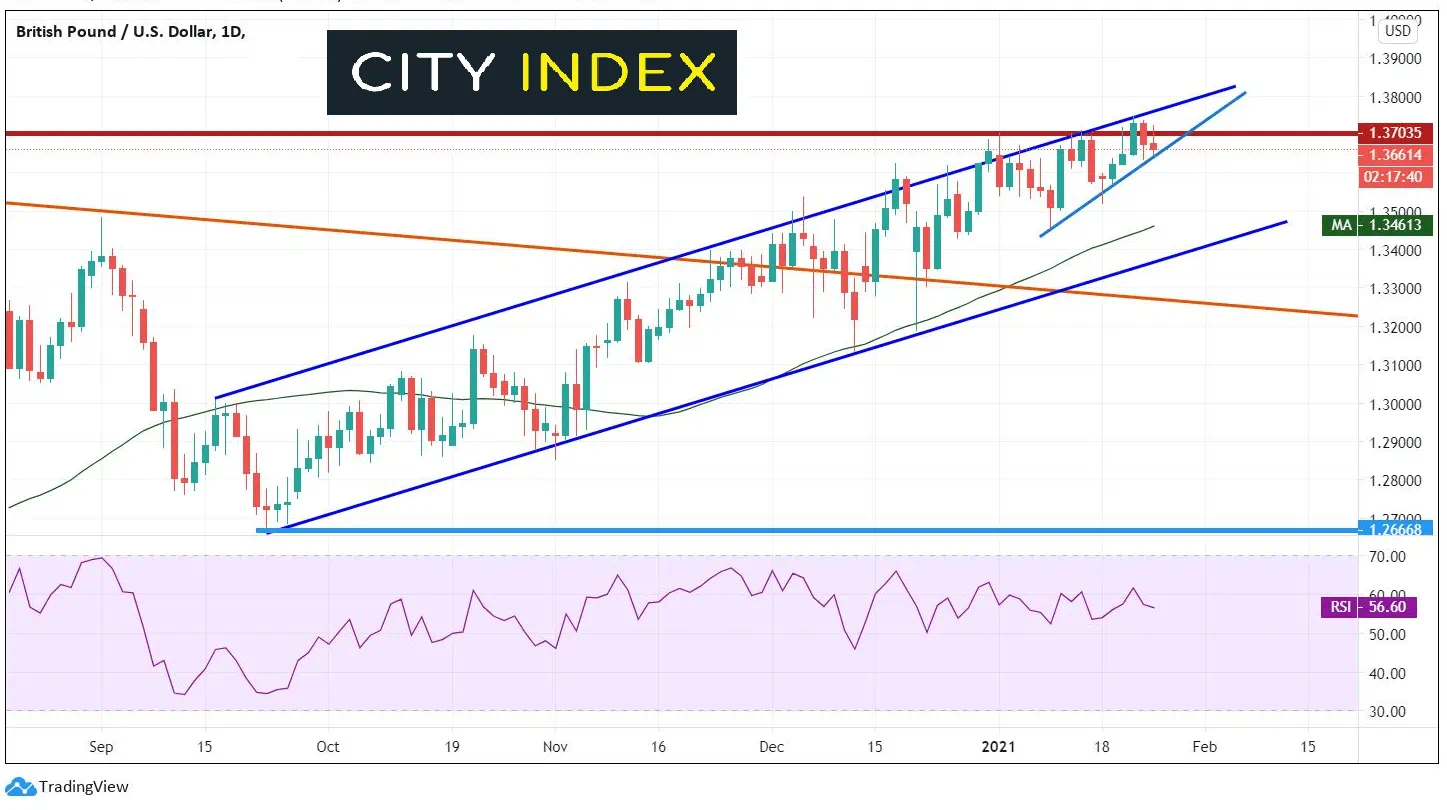
Another currency pair, GBP/USD, has been in a forming a possible reversal formation of its own. The pair has been in an upward sloping chancel since mid-September 2020. On January 11th, GBP/USD began forming an ascending wedge. However, the GBP/USD failed to close above horizontal resistance at 1.3703 and the upper trendline of the channel. The pair is nearing the apex of the ascending wedge. A move higher in the US Dollar would cause GBP/USD to move lower, breaking below the upward sloping trendline of the wedge and towards the target at 1.3450. The 50 Day moving average corresponds with that level as well. Below there is the upward sloping bottom trendline for the channel near 1.3370.
Source: Tradingview, City Index
Watch for more volatility in stocks this week ahead of FOMC on Wednesday. In addition, keep an eye on inflation data and news regarding the vaccine rollout. Any catalyst that causes stocks to move lower, should cause the DXY to move higher.
Learn more about forex trading opportunities.
On a daily timeframe, the S&P 500 has moved to a level where it is decision time for traders. The index is currently at the 161.8% Fibonacci extension from the highs on September 2nd, 2020 to the lows on September 24th, 2020. In addition, price is pushing up against the trendline dating back to September 2nd. The stock index is also near the apex of an ascending triangle. The RSI is diverging with price. Some stocks, such as BBBY and GME, have gotten the snot squeezed out of them. Volatility was wild today, as the S&P 500 traded from 3853.25 down to 3788.50 in just under ½ hour, and by mid-afternoon, was back to positive.
Source: Tradingview, CME, FOREX.com
The Volatility S&P 500 Index (VIX) may be warning us of something. As the S&P 500 continued to put in higher highs, in December 2020, the VIX began putting in a series of higher lows! This indicates that traders are buying insurance against stocks in case of a risk-off move.
Source: Tradingview, CBOE, FOREX.com
Does this indicate there is more volatility or even a pullback in stocks ahead? And if so, what does that mean for the US Dollar?
What could cause a pullback in stocks this week?
- A more hawkish Powell
- A higher core PCE (the Fed watches this to gauge inflation)
- Fears of a lower economic stimulus package than the $1.9 trillion Biden proposed
- Fears of “looking ahead” to tapering
- Problems with vaccine rollout
Anything can be a catalyst. As traders, we must determine what to do when, and if, stocks move lower. If stocks move lower for one of the above reasons, it will likely mean a US Dollar move higher.
DXY
The US Dollar Index (DXY) has not done much over the past month. The index moved lower into a support zone (blue) and has been trading in that zone since. The DXY has been oscillating around the 161.8% Fibonacci retracement level of the lows of September 1st to the highs on September 25th. However, by moving sideways, it did manage to move out of a descending wedge. If stocks move lower, DXY should move higher, above recent highs at 90.95. A complete retracement of the wedge is at 94.30, but that is a way off. Near term horizontal resistance before this is at 91.24, 91.75 and 92.01.
Source: Tradingview, FOREX.com
For insight on EUR/USD, see the Currency pair of the week.
Another currency pair, GBP/USD, has been in a forming a possible reversal formation of its own. The pair has been in an upward sloping chancel since mid-September 2020. On January 11th, GBP/USD began forming an ascending wedge. However, the GBP/USD failed to close above horizontal resistance at 1.3703 and the upper trendline of the channel. The pair is nearing the apex of the ascending wedge. A move higher in the US Dollar would cause GBP/USD to move lower, breaking below the upward sloping trendline of the wedge and towards the target at 1.3450. The 50 Day moving average corresponds with that level as well. Below there is the upward sloping bottom trendline for the channel near 1.3370.
Source: Tradingview, FOREX.com
Watch for more volatility in stocks this week ahead of FOMC on Wednesday. In addition, keep an eye on inflation data and news regarding the vaccine rollout. Any catalyst that causes stocks to move lower, should cause the DXY to move higher.
Learn more about forex trading opportunities.
Latest market news




The complete CFD trading experience
Award-winning platforms, competitive spreads, low commissions and dedicated support.
We live and breathe the markets and are dedicated to helping traders realise their ambitions as we continue to set the industry bar.
Economic calendar
Web Trader platform
Our sophisticated web-based platform is packed with features.
Related articles
Equity Indices Q4, 2026 Outlook: Cracks Begin to Show
There's still an open door for a melt-up in the S&P 500 and Nasdaq but the Dow and Russell 2000 are looking more vulnerable, and until calm hits the Treasuries market there's a higher probability for volatility. The big question is whether that's a next quarter theme or not.

S&P 500 Forecast: SPX rises as oil prices fall, but treasuries remain at multi-decade highs
U.S. stocks are rising on Friday after a volatile week that saw a surge in Treasury yields ripple through financial markets.

S&P 500 forecast: Stocks extend drop as correction risks grow
US and global equity markets have extended Wednesday’s sell-off, with Wall Street opening lower after a weak handover from Asia and Europe. The deterioration in risk appetite has been spreading across global markets. The dollar was firmer, Treasury yields were holding onto yesterday’s gains, while gold, silver and bitcoin were all under pressure alongside equities and major currencies.
StoneX Europe Ltd may make third party material available on this website which may contain information included but not limited to the conditions of financial markets. The material is for information purposes only and does not contain, and should not be construed as containing, investment advice and/or investment recommendation and/or an investment research and/or an offer of or solicitation for any transactions in financial instruments; any decision to enter into a specific transaction shall be made by the client following an assessment by him/her of their situation.
StoneX Europe Ltd makes no representation or warranty and assumes no liability as to the accuracy or completeness of the information provided, nor any loss arising from any investment based on a recommendation, forecast or other information supplied. You should always seek independent advice as to your suitability to speculate in any related markets and your ability to assume the associated risks, if you are at all unsure. We are not under any obligation to update any such material. Any opinion made may be personal to the author and may not reflect the opinion of StoneX Europe Ltd.