




WTI Spikes as EIA Reports Large Draw
All the negative news lately made the perfect setting for a short squeeze today
Share this:

West Texas Oil futures were up 2.40% today near $55.82 after the EIA (Energy Information Administration) reported a surprise draw in crude inventories last week. The EIA reported a draw of -1.699M barrels vs a 2.232M expected, and 9.281M the prior week. Crude has been getting battered lately due to fear of the less demand from the global slowdown and the China-US trade war. In addition, yesterday’s API Weekly Crude Oil Stock showed a RISE of 4.45M barrels and OPEC said they would consider reducing production when they meet in December.
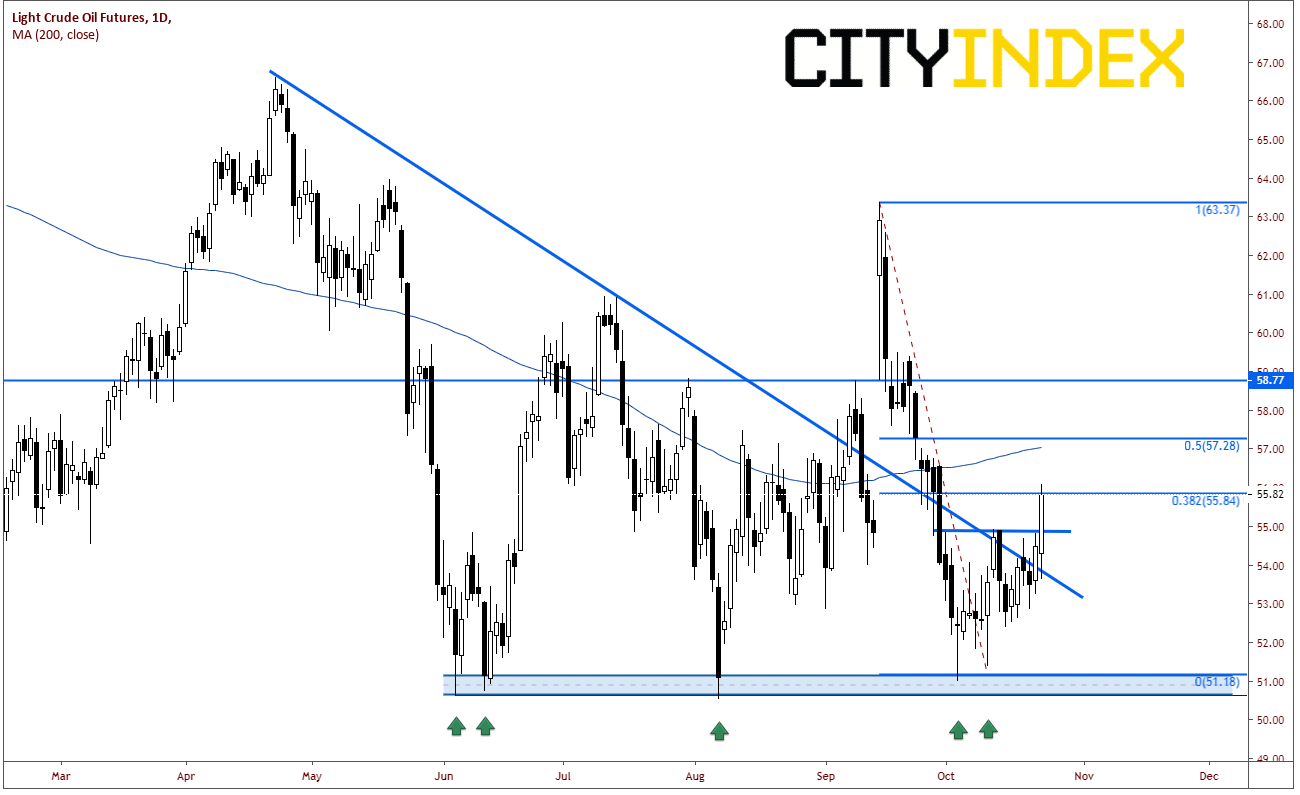
All the negative news lately made the perfect setting for a good old-fashioned short squeeze today. A short squeeze occurs when the market is extremely bearish in a position and buyers come in and take out the stops from the shorts, thus “squeezing” price higher. This seems to be what happened today. After testing the lows of 50.50 five times since the beginning of June, WTI broke those a descending trending yesterday and closed above it just below horizontal resistance at 54.90.
Source: Tradingview, City Index, NYMEX
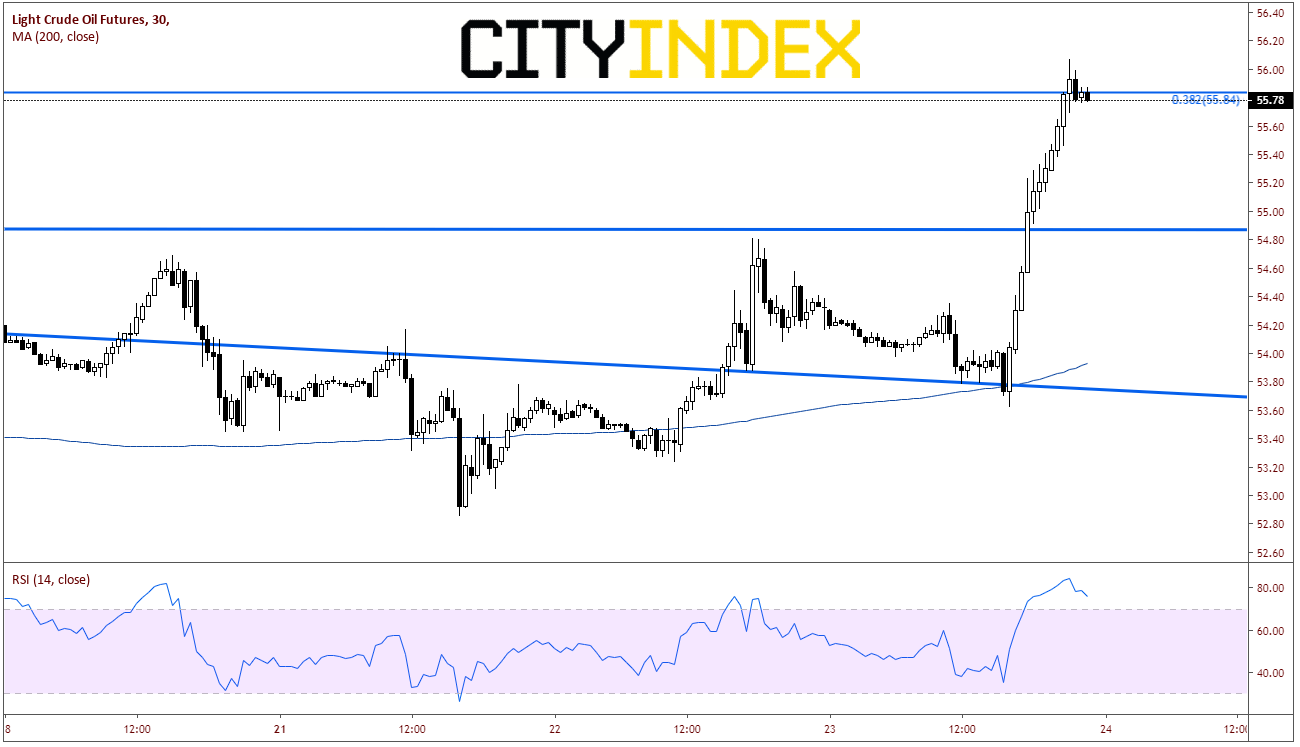
On a 30-minutes chart, we can see that WTI was retesting the broken trendline when the data was released. The market moved swiftly higher and price broke through the 54.90 level. From there is was a $1.00 squeeze higher as shorts got stopped out of the market. Also notice that price halted near the 38.2% Fibonacci retracement level from the highs on September 16th (after the attack on Saudi Aramco) to the lows on October 3rd. (see daily chart) The RSI on the 30-minute chart is in overbought territory as well, implying a short-term pullback may be ahead.
Source: Tradingview, City Index, NYMEX
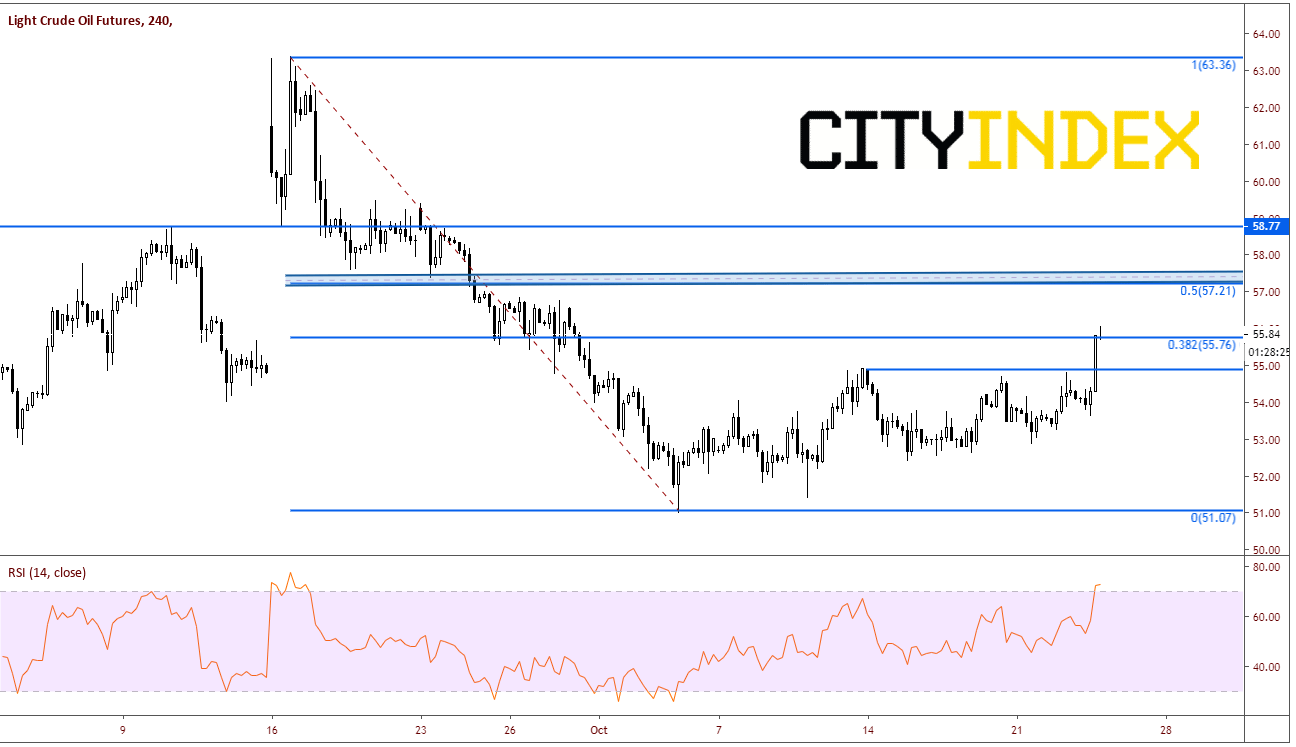
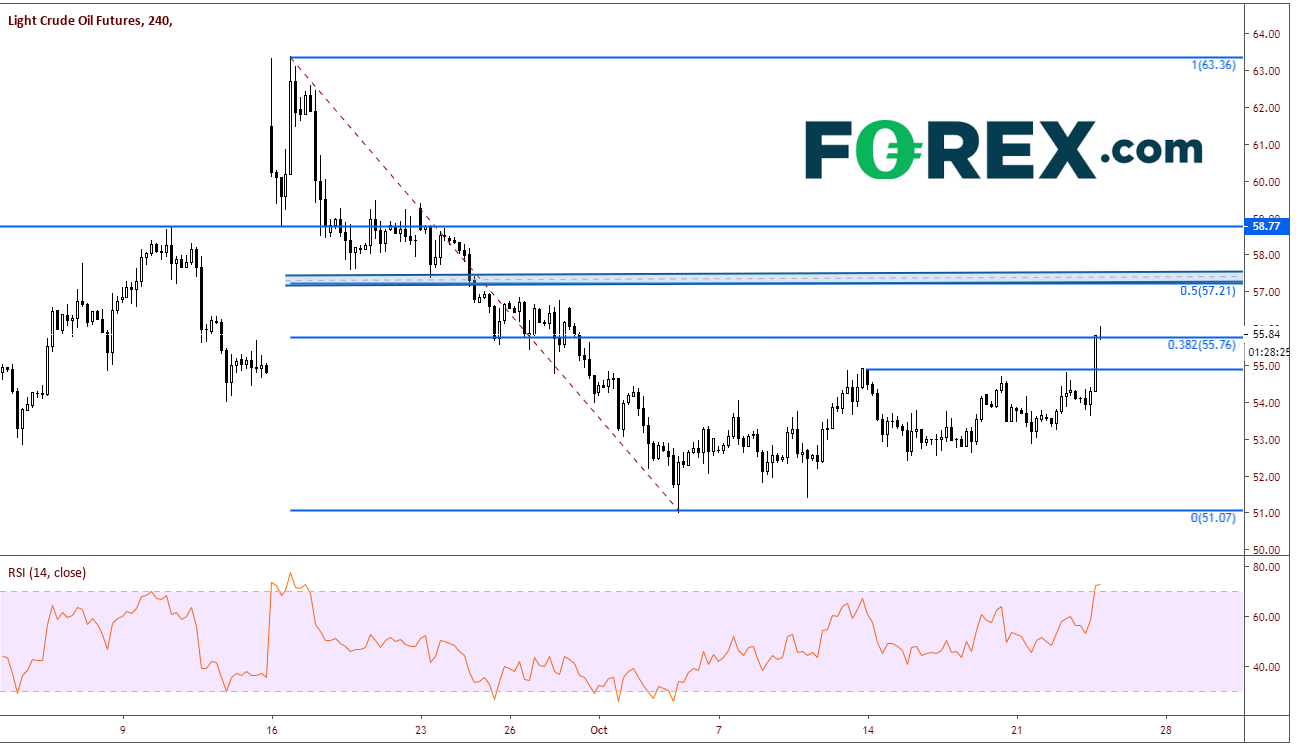
On a 240-minute chart, first resistance is horizontal resistance and the 50% retracement level from the previously mentioned timeframe near 57.25. If price breaks above, next level of horizontal resistance is near 58.75. First support comes in near 55.00. Below that, there isn’t much in the way for price to head back towards 51.00.
West Texas Oil futures were up 2.40% today near $55.82 after the EIA (Energy Information Administration) reported a surprise draw in crude inventories last week. The EIA reported a draw of -1.699M barrels vs a 2.232M expected, and 9.281M the prior week. Crude has been getting battered lately due to fear of the less demand from the global slowdown and the China-US trade war. In addition, yesterday’s API Weekly Crude Oil Stock showed a RISE of 4.45M barrels and OPEC said they would consider reducing production when they meet in December.
All the negative news lately made the perfect setting for a good old-fashioned short squeeze today. A short squeeze occurs when the market is extremely bearish in a position and buyers come in and take out the stops from the shorts, thus “squeezing” price higher. This seems to be what happened today. After testing the lows of 50.50 five times since the beginning of June, WTI broke those a descending trending yesterday and closed above it just below horizontal resistance at 54.90.
Source: Tradingview, FORX.com, NYMEX
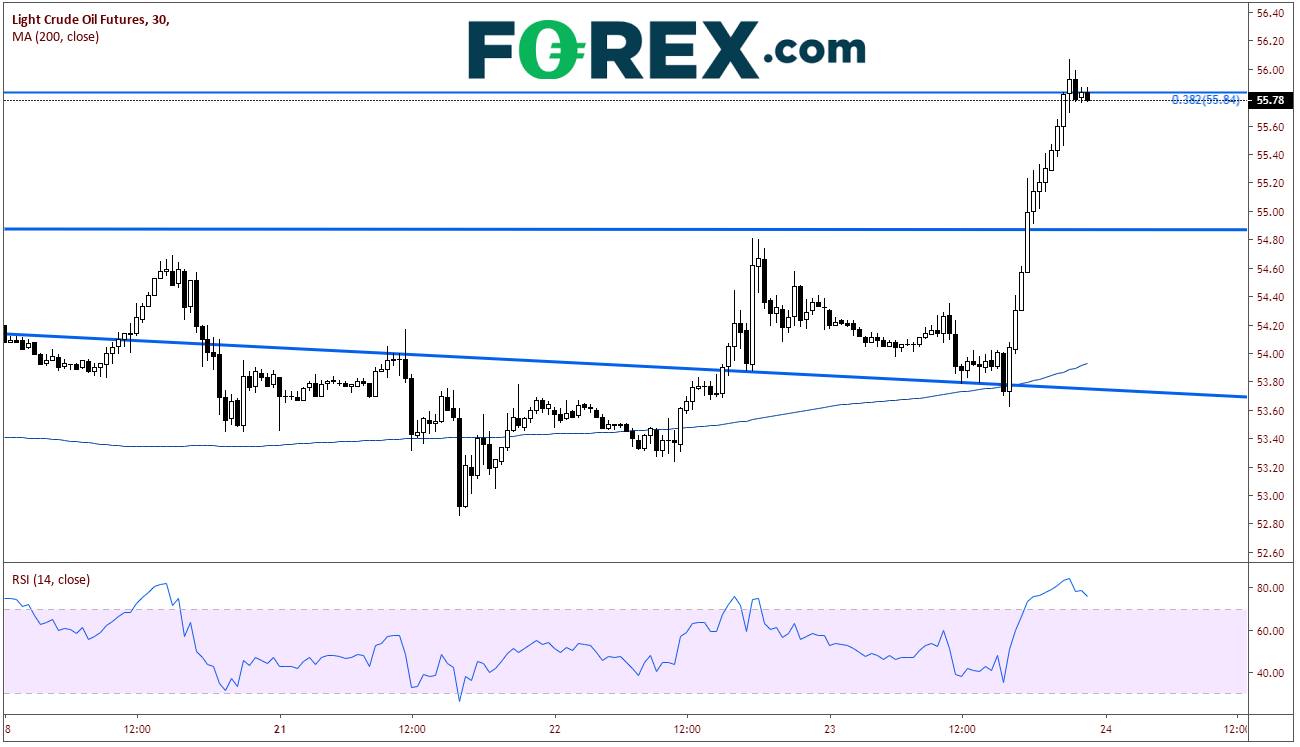
On a 30-minutes chart, we can see that WTI was retesting the broken trendline when the data was released. The market moved swiftly higher and price broke through the 54.90 level. From there is was a $1.00 squeeze higher as shorts got stopped out of the market. Also notice that price halted near the 38.2% Fibonacci retracement level from the highs on September 16th (after the attack on Saudi Aramco) to the lows on October 3rd. (see daily chart) The RSI on the 30-minute chart is in overbought territory as well, implying a short-term pullback may be ahead.
Source: Tradingview, FORX.com, NYMEX
On a 240-minute chart, first resistance is horizontal resistance and the 50% retracement level from the previously mentioned timeframe near 57.25. If price breaks above, next level of horizontal resistance is near 58.75. First support comes in near 55.00. Below that, there isn’t much in the way for price to head back towards 51.00.
Related tags:
Latest market news




The complete CFD trading experience
Award-winning platforms, competitive spreads, low commissions and dedicated support.
We live and breathe the markets and are dedicated to helping traders realise their ambitions as we continue to set the industry bar.
Economic calendar
Web Trader platform
Our sophisticated web-based platform is packed with features.
Related articles
S&P 500 Forecast: SPX rises as oil prices fall, but treasuries remain at multi-decade highs
U.S. stocks are rising on Friday after a volatile week that saw a surge in Treasury yields ripple through financial markets.

Oil Quietly Hands the Fed a Reason to Stay Hawkish
Oil prices and the U.S. dollar are both on the front foot as elevated energy costs feed Fed warnings that inflation may prove sticky.

Wall Street Forecast: DJIA falls as treasury yields hit new highs and ahead of the Trump-Xi summit
U.S. stocks are falling, further extending losses from the previous session, as oil prices move higher alongside Treasury yields and caution reigns ahead of the summit between President Trump and Xi Jinping.

StoneX Europe Ltd may make third party material available on this website which may contain information included but not limited to the conditions of financial markets. The material is for information purposes only and does not contain, and should not be construed as containing, investment advice and/or investment recommendation and/or an investment research and/or an offer of or solicitation for any transactions in financial instruments; any decision to enter into a specific transaction shall be made by the client following an assessment by him/her of their situation.
StoneX Europe Ltd makes no representation or warranty and assumes no liability as to the accuracy or completeness of the information provided, nor any loss arising from any investment based on a recommendation, forecast or other information supplied. You should always seek independent advice as to your suitability to speculate in any related markets and your ability to assume the associated risks, if you are at all unsure. We are not under any obligation to update any such material. Any opinion made may be personal to the author and may not reflect the opinion of StoneX Europe Ltd.