





Xiaomi Off the blacklist What now
After a 6% move higher on Wednesday, the technology giant is bumping up against resistance
Share this:

Earlier this week, Chinese smartphone marker Xiaomi Corp. was finally removed from the “Blacklist” which restricted Americans from investing in the company. It was placed on the list by the Trump Administration in January after being labeled a Communist Chinese Military Company. In March, a US Federal Judge placed a temporary halt on the US investment ban, noting that the US government’s process for determining that the firm was tied to the Chinese military was “deeply flawed”.
Technical Analysis
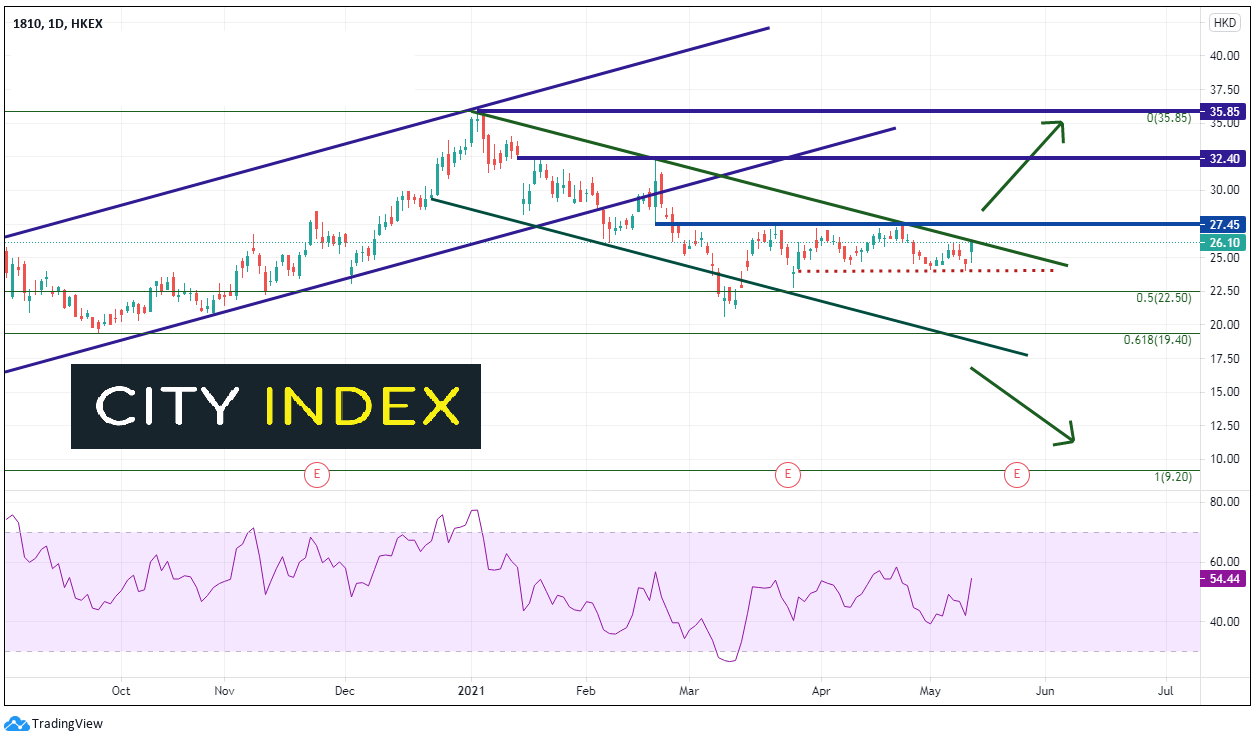
After a huge move higher from the March 2020 lows of 9.20 to the January 5th highs of 35.90, the pair moved lower in a corrective channel formation. The stock pulled back to the 50% retracement of the same time period, near 22.50. However, after a bounce on the news from March, Xiaomi began to trade in a range between 24.10 and 27.45. After a 6% move higher on Wednesday, the technology giant is bumping up against the top, downward sloping trendline of the channel from the January 5th highs. If price can break above horizontal resistance at 27.45, the next resistance is 32.40, ahead of the all-time highs near 35.85. That said, if the trendline resistance holds, first support is at the May 11th lows near 24.05. The next level of support is at the previously mentioned 50% retracement level near 22.50, then the March 9th lows at 20.65. The 61.8% Fibonacci retracement is just below there at 19.40.
Source: Tradingview, City Index
Learn more about equity trading opportunities.
What about the Hang Seng?
As mentioned, Xiaomi popped 6% on the news of the removal from the US blacklist which helped push the Hang Seng higher for the day. However, with major stocks indices in the West down roughly 2.0% - 3.0%, the Hang Seng may get pulled lower, bringing shares of Xiaomi lower with it. The index moved higher in aggressive fashion from the lows of September 28th, 2020 to the highs of February 18th, 2021, near 21096. Since then, the Hang Seng has pulled back in a descending wedge formation to just below the 38.2% Fibonacci retracement level from the same time period. The 50% retracement level and horizontal support are below at 27024. The bottom trendline of the descending wedge also converges near this level. The 61.8% Fibonacci retracement level is the next level of support at 26063. The top trendline acts as the first level of resistance at 28750 . Horizontal resistance is above at 29306 and 30002. The 30000 level also acts as psychological round number resistance.
Source: Tradingview, City Index
Learn more about index trading opportunities.
Xiaomi got a nice boost in price after the news that the stock was removed from the blacklist of stocks that the US couldn’t invest in. However, with the steep selloff of stock markets in the US, traders need to consider if the Hang Seng will get dragged lower with it, and therefore, may bring Xiaomi lower as well.
Earlier this week, Chinese smartphone marker Xiaomi Corp. was finally removed from the “Blacklist” which restricted Americans from investing in the company. It was placed on the list by the Trump Administration in January after being labeled a Communist Chinese Military Company. In March, a US Federal Judge placed a temporary halt on the US investment ban, noting that the US government’s process for determining that the firm was tied to the Chinese military was “deeply flawed”.
Technical Analysis
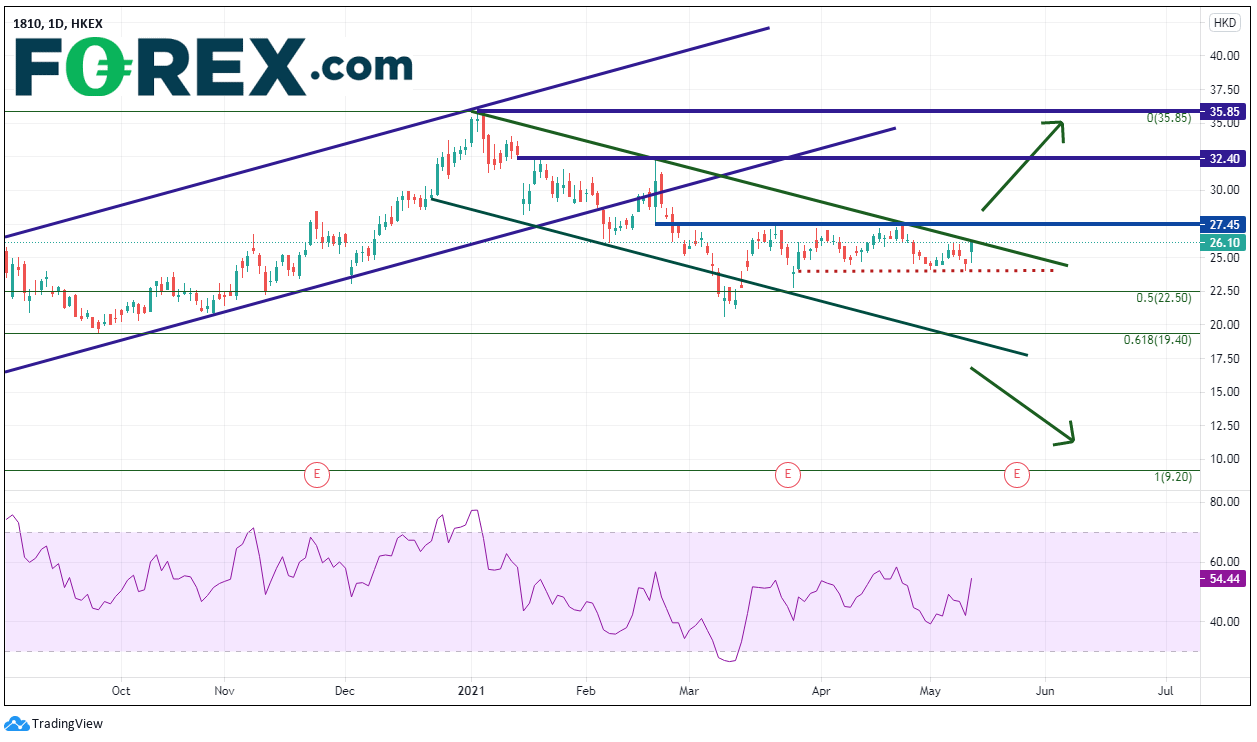
After a huge move higher from the March 2020 lows of 9.20 to the January 5th highs of 35.90, the pair moved lower in a corrective channel formation. The stock pulled back to the 50% retracement of the same time period, near 22.50. However, after a bounce on the news from March, Xiaomi began to trade in a range between 24.10 and 27.45. After a 6% move higher on Wednesday, the technology giant is bumping up against the top, downward sloping trendline of the channel from the January 5th highs. If price can break above horizontal resistance at 27.45, the next resistance is 32.40, ahead of the all-time highs near 35.85. That said, if the trendline resistance holds, first support is at the May 11th lows near 24.05. The next level of support is at the previously mentioned 50% retracement level near 22.50, then the March 9th lows at 20.65. The 61.8% Fibonacci retracement is just below there at 19.40.
Source: Tradingview, FOREX.com
Learn more about equity trading opportunities.
What about the Hang Seng?
As mentioned, Xiaomi popped 6% on the news of the removal from the US blacklist which helped push the Hang Seng higher for the day. However, with major stocks indices in the West down roughly 2.0% - 3.0%, the Hang Seng may get pulled lower, bringing shares of Xiaomi lower with it. The index moved higher in aggressive fashion from the lows of September 28th, 2020 to the highs of February 18th, 2021, near 21096. Since then, the Hang Seng has pulled back in a descending wedge formation to just below the 38.2% Fibonacci retracement level from the same time period. The 50% retracement level and horizontal support are below at 27024. The bottom trendline of the descending wedge also converges near this level. The 61.8% Fibonacci retracement level is the next level of support at 26063. The top trendline acts as the first level of resistance at 28750 . Horizontal resistance is above at 29306 and 30002. The 30000 level also acts as psychological round number resistance.
Source: Tradingview, FOREX.com
Learn more about index trading opportunities.
Xiaomi got a nice boost in price after the news that the stock was removed from the blacklist of stocks that the US couldn’t invest in. However, with the steep selloff of stock markets in the US, traders need to consider if the Hang Seng will get dragged lower with it, and therefore, may bring Xiaomi lower as well.
Related tags:
Latest market news




The complete CFD trading experience
Award-winning platforms, competitive spreads, low commissions and dedicated support.
We live and breathe the markets and are dedicated to helping traders realise their ambitions as we continue to set the industry bar.
Economic calendar
Web Trader platform
Our sophisticated web-based platform is packed with features.
Related articles
Gold Q4 2026 outlook: Resilience in the face of rallying dollar and yields
As we headed towards the latter stages of Q3 and into Q4, the Fed had just hiked rates in a hawkish FOMC meeting, while the likes of the ECB and BoJ had also tightened their respective policies. Oil prices remained elevated amid the prolonged US-Iran conflict. Meanwhile, bond yields were breaking out, and the dollar was higher across the board. Yet, remarkably, gold was still holding in the positive territory for the third quarter, even if it had weakened somewhat in September.

Oil Quietly Hands the Fed a Reason to Stay Hawkish
Oil prices and the U.S. dollar are both on the front foot as elevated energy costs feed Fed warnings that inflation may prove sticky.

S&P 500 forecast: Stocks extend drop as correction risks grow
US and global equity markets have extended Wednesday’s sell-off, with Wall Street opening lower after a weak handover from Asia and Europe. The deterioration in risk appetite has been spreading across global markets. The dollar was firmer, Treasury yields were holding onto yesterday’s gains, while gold, silver and bitcoin were all under pressure alongside equities and major currencies.
StoneX Europe Ltd may make third party material available on this website which may contain information included but not limited to the conditions of financial markets. The material is for information purposes only and does not contain, and should not be construed as containing, investment advice and/or investment recommendation and/or an investment research and/or an offer of or solicitation for any transactions in financial instruments; any decision to enter into a specific transaction shall be made by the client following an assessment by him/her of their situation.
StoneX Europe Ltd makes no representation or warranty and assumes no liability as to the accuracy or completeness of the information provided, nor any loss arising from any investment based on a recommendation, forecast or other information supplied. You should always seek independent advice as to your suitability to speculate in any related markets and your ability to assume the associated risks, if you are at all unsure. We are not under any obligation to update any such material. Any opinion made may be personal to the author and may not reflect the opinion of StoneX Europe Ltd.