



Yen Weakens on Downbeat Data
The USD/JPY holds up well after the Japanese government released worse-than-expected economic data...
Share this:
The USD/JPY holds up well after the Japanese government released worse-than-expected economic data.
Japan's industrial production dropped 8.4% on month in May (-5.7% expected), mainly dragged by automakers cutting back production. This followed a 9.8% contraction in April. Global demand remained weak in May thanks to coronavirus-induced lockdown of various major economies, causing severe impact to Japan's export-reliant manufacturing sector.
Japan Industrial Production (month-on-month):

Source: Trading Economics
Meanwhile, the situation seemed to improve a bit in May (-8.4% vs -9.8% in April), and investors should watch closely to see if the improvement continues amid reopening of economies in the U.S. and around the world.
Also, Japan's jobless rate rose to 2.9% in May (2.8% expected) from 2.6% in April, the highest level in three years.
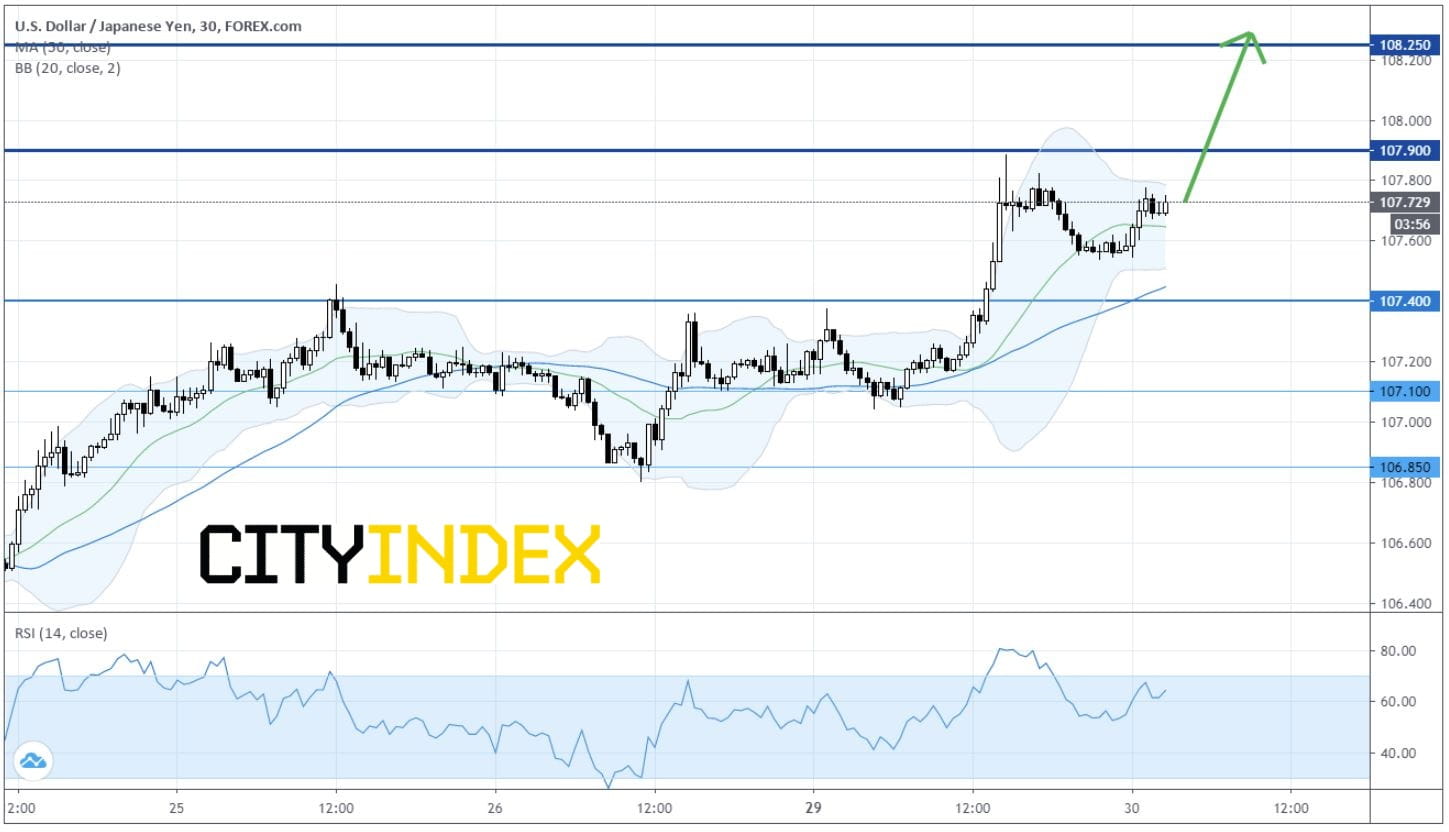
On an Intraday 30-minute Chart, USD/JPY remains on the upside after rebounding from a low of 107.04 seen yesterday.
Source: GAIN Capital, TradingView
Currently USD/JPY stays at levels above both 20-period and 50-period moving averages.
And it is striking against the Upper Bollinger Band.
Therefore, the Technical Configuration still favor a Bullish intraday bias.
Overhead Resistance at expected at 107.90 (around the high of yesterday).
In case USD/JPY breaks above 107.90, it could encounter Further Resistance at 108.25.
Bullish investors should regard the level of 107.40 (a previous price resistance) as the Key Support (Stop-loss Level).
Japan's industrial production dropped 8.4% on month in May (-5.7% expected), mainly dragged by automakers cutting back production. This followed a 9.8% contraction in April. Global demand remained weak in May thanks to coronavirus-induced lockdown of various major economies, causing severe impact to Japan's export-reliant manufacturing sector.
Japan Industrial Production (month-on-month):
Source: Trading Economics
Meanwhile, the situation seemed to improve a bit in May (-8.4% vs -9.8% in April), and investors should watch closely to see if the improvement continues amid reopening of economies in the U.S. and around the world.
Also, Japan's jobless rate rose to 2.9% in May (2.8% expected) from 2.6% in April, the highest level in three years.
On an Intraday 30-minute Chart, USD/JPY remains on the upside after rebounding from a low of 107.04 seen yesterday.
Source: GAIN Capital, TradingView
Currently USD/JPY stays at levels above both 20-period and 50-period moving averages.
And it is striking against the Upper Bollinger Band.
Therefore, the Technical Configuration still favor a Bullish intraday bias.
Overhead Resistance at expected at 107.90 (around the high of yesterday).
In case USD/JPY breaks above 107.90, it could encounter Further Resistance at 108.25.
Bullish investors should regard the level of 107.40 (a previous price resistance) as the Key Support (Stop-loss Level).
The USD/JPY holds up well after the Japanese government released worse-than-expected economic data.
Japan's industrial production dropped 8.4% on month in May (-5.7% expected), mainly dragged by automakers cutting back production. This followed a 9.8% contraction in April. Global demand remained weak in May thanks to coronavirus-induced lockdown of various major economies, causing severe impact to Japan's export-reliant manufacturing sector.
Japan Industrial Production (month-on-month):
Source: Trading Economics
Meanwhile, the situation seemed to improve a bit in May (-8.4% vs -9.8% in April), and investors should watch closely to see if the improvement continues amid reopening of economies in the U.S. and around the world.
Also, Japan's jobless rate rose to 2.9% in May (2.8% expected) from 2.6% in April, the highest level in three years.
On an Intraday 30-minute Chart, USD/JPY remains on the upside after rebounding from a low of 107.04 seen yesterday.

Source: GAIN Capital, TradingView
Currently USD/JPY stays at levels above both 20-period and 50-period moving averages.
And it is striking against the Upper Bollinger Band.
Therefore, the Technical Configuration still favor a Bullish intraday bias.
Overhead Resistance at expected at 107.90 (around the high of yesterday).
In case USD/JPY breaks above 107.90, it could encounter Further Resistance at 108.25.
Bullish investors should regard the level of 107.40 (a previous price resistance) as the Key Support (Stop-loss Level).
Japan's industrial production dropped 8.4% on month in May (-5.7% expected), mainly dragged by automakers cutting back production. This followed a 9.8% contraction in April. Global demand remained weak in May thanks to coronavirus-induced lockdown of various major economies, causing severe impact to Japan's export-reliant manufacturing sector.
Japan Industrial Production (month-on-month):
Source: Trading Economics
Meanwhile, the situation seemed to improve a bit in May (-8.4% vs -9.8% in April), and investors should watch closely to see if the improvement continues amid reopening of economies in the U.S. and around the world.
Also, Japan's jobless rate rose to 2.9% in May (2.8% expected) from 2.6% in April, the highest level in three years.
On an Intraday 30-minute Chart, USD/JPY remains on the upside after rebounding from a low of 107.04 seen yesterday.
Source: GAIN Capital, TradingView
Currently USD/JPY stays at levels above both 20-period and 50-period moving averages.
And it is striking against the Upper Bollinger Band.
Therefore, the Technical Configuration still favor a Bullish intraday bias.
Overhead Resistance at expected at 107.90 (around the high of yesterday).
In case USD/JPY breaks above 107.90, it could encounter Further Resistance at 108.25.
Bullish investors should regard the level of 107.40 (a previous price resistance) as the Key Support (Stop-loss Level).


The complete CFD trading experience
Award-winning platforms, competitive spreads, low commissions and dedicated support.
We live and breathe the markets and are dedicated to helping traders realise their ambitions as we continue to set the industry bar.
Economic calendar
Web Trader platform
Our sophisticated web-based platform is packed with features.
Related articles

NZD/USD pressure mounts as payrolls looms large
NZD/USD has fallen sharply as Fed rate expectations reset higher, but extreme downside stretch and major support raise the risk of a violent counter-trend rebound.

US Core PCE Preview: Stale or Significant for the Fed
Core PCE inflation takes center stage Wednesday, with traders watching for signs of renewed price pressure and clues on whether the Fed could hike again in October.

Australian Dollar Forecast: AUD/USD Four-Week Slide Nears Critical Uptrend Support 9 29 2026
Aussie momentum has deteriorated sharply into quarter-end, with inflation, Core PCE and NFP on tap as AUD/USD closes in on a pivotal technical threshold.

StoneX Europe Ltd may make third party material available on this website which may contain information included but not limited to the conditions of financial markets. The material is for information purposes only and does not contain, and should not be construed as containing, investment advice and/or investment recommendation and/or an investment research and/or an offer of or solicitation for any transactions in financial instruments; any decision to enter into a specific transaction shall be made by the client following an assessment by him/her of their situation.
StoneX Europe Ltd makes no representation or warranty and assumes no liability as to the accuracy or completeness of the information provided, nor any loss arising from any investment based on a recommendation, forecast or other information supplied. You should always seek independent advice as to your suitability to speculate in any related markets and your ability to assume the associated risks, if you are at all unsure. We are not under any obligation to update any such material. Any opinion made may be personal to the author and may not reflect the opinion of StoneX Europe Ltd.