
Over the past two trading sessions, Bitcoin’s price movements have shown a predominant bearish bias, with a decline of more than 3.8% in the short term. This pullback has prevented BTC from approaching its historical highs again. For now, the confidence generated after the Federal Reserve (Fed) rate cut has begun to fade, triggering a wave of profit-taking that reinforces the perception of constant selling pressure. If confidence continues to deteriorate, bearish bias could remain dominant in the short term.

Is the Lower-Rate Rally Over?
After the Fed’s decision last week to cut rates by 0.25%, it seemed that Bitcoin would take advantage of this macroeconomic context as a starting point for a significant upward move. This expectation made sense, as lower rates generally favor the economy and increase demand for risk assets such as cryptocurrencies in the short term.
However, the effect of the rate cut has proven to be short-lived. Bearish sentiment is now growing, driven mainly by the perception that long positions had already been built ahead of the decision and that, once speculation faded, profit-taking kicked in. This has left little room for new buying activity in the Bitcoin market. According to Coinglass, nearly $1.7 billion in Bitcoin futures positions were liquidated in the past 24 hours across major exchanges, highlighting how the initial positive effect of lower rates has quickly lost momentum.
The open interest, which reflects the total number of futures positions, also confirms this trend. Since September 12, the indicator has been steadily declining and now stands at around $42 billion, down from the $44 billion that marked the yearly high. This decline shows reduced activity and a wave of position closures in recent sessions.

Source: CryptoQuant
Thus, in recent sessions there has been a clear reduction in activity and in the creation of new positions, signaling that demand is not holding up. What was initially seen as a positive catalyst for Bitcoin under lower rates has had the opposite effect: selling pressure remains in place, and as this trend continues, it could intensify in the short term.
Confidence Trends
The Fear and Greed Index for the crypto market currently sits at 47 points, in the neutral zone, but with a downward slope that could soon push it into the “fear” zone (40 points). Since September 11, the index has shown progressively lower readings, reflecting a steady erosion of investor confidence.
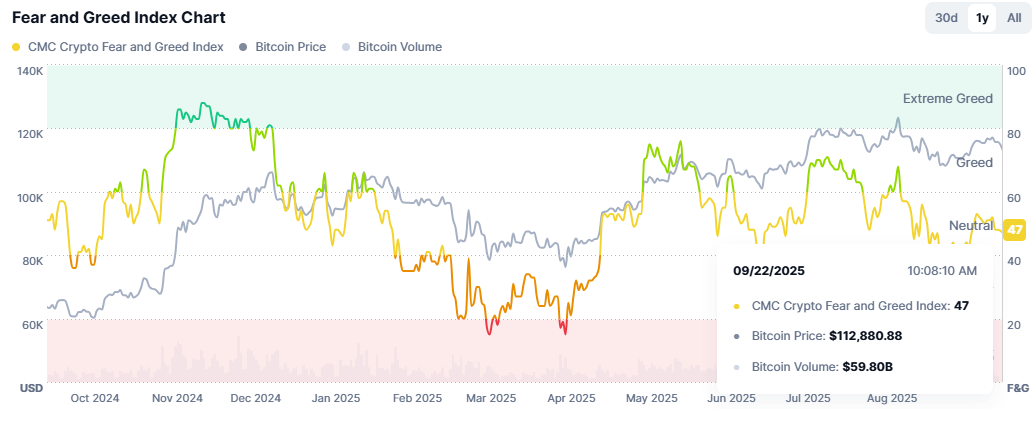
Source: Coinmarketcap
This weakening of sentiment further fuels the bearish pressure on Bitcoin. As the index continues to fall and approaches the “fear” threshold, demand is likely to remain weak. In that scenario, selling pressure could intensify even more aggressively in the coming sessions.
Is Bitcoin Still Dominant?
The Bitcoin dominance chart shows that the cryptocurrency continues to account for about 57% of total market capitalization, although this share has fallen from the 65% recorded in June. At the same time, Ethereum has gained ground, with its market share rising from 9% in June to 12% currently, reflecting growing interest in other cryptocurrencies.
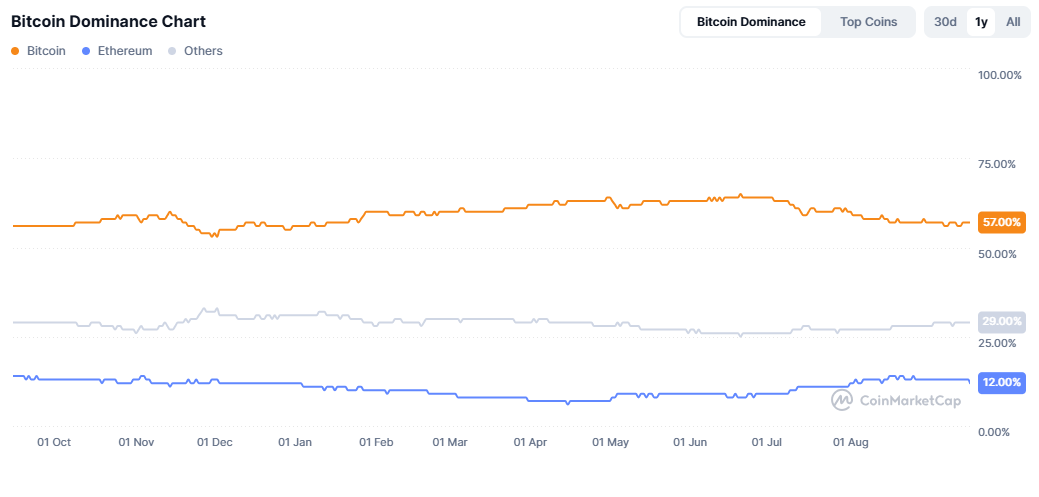
Source: Coinmarketcap
The decline in Bitcoin’s dominance is mainly due to the fact that recent price movements have failed to attract sufficient investor interest, prompting many to shift toward altcoins. As Ethereum and other smaller projects gain traction, Bitcoin demand could continue to be affected, keeping a bearish bias in place as investors diversify into assets with greater volatility and short-term return potential.
Bitcoin Technical Forecast

Source: StoneX, Tradingview
- Bearish momentum emerges: Despite attempts in recent weeks to consolidate a short-term uptrend, a new dominant selling bias has emerged, halting Bitcoin’s recent bullish momentum. If selling pressure persists, a more consistent downtrend could develop, with progressively lower highs appearing on the chart.
- RSI: The RSI has crossed below the neutral 50 level, indicating that the average of the last 14 sessions is trending bearish. If this downward path continues, selling pressure could intensify further.
- MACD: The MACD histogram remains close to the zero line, signaling indecision in short-term moving averages. Unless a clear direction emerges, BTC could remain in a neutral or uncertain pattern in the coming sessions.
Key Levels:
- 122,400 – Major Resistance: Represents the all-time high zone and the most important barrier for buyers. A sustained breakout above this level would confirm the continuation of the bullish trend seen in previous weeks.
- 113,100 – Nearby Barrier: Level where the 50-period simple moving average converges with the 23.6% Fibonacci retracement. As long as price holds here, BTC could consolidate within a short-term neutral range.
- 105,000 – Critical Support: Linked to the 38.2% Fibonacci retracement, this is the most important support level. A break below would open the door to deeper declines and confirm the formation of a more pronounced bearish trend.
Written by Julian Pineda, CFA – Market Analyst
Follow him: @julianpineda25