


The overbought trend in gold has finally found profit taking and alongside that move Bitcoin prices have shown greater signs of recovery with a fresh two-week high. Gold has been in an aggressive bullish trend since last February and there’s been two distinct digestion periods, both of which were bull flag formations, and as those built, Bitcoin prices jumped up to 105k and 120k. Now 105k has held as key support, and if we do see continued consolidation in gold, BTC/USD can stand to benefit from anti-fiat flows going into a less overbought market.

I looked into this a couple of weeks ago, presenting Bitcoin as a gold alternative and using the prior two digestion periods in gold as an example.
The current rally in gold sparked in February of 2024 and while it hasn’t been a linear move, buyers have been in control for most of the time. There’s just two instances on the daily chart where that wasn’t the cast, and in each, it was a digestion formation in the form of a symmetrical triangle.
Normally those patterns carry no directional component, as it’s both higher-lows and lower-highs, but when married with a strong prior trend, deduction can lend itself into a directional lean. After an outsized rally, normally, there will be buyers looking to take profits, leading to supply which then pushes lower prices. When new buyers come in to exhaust that supply and then offer even more demand is when and where the trend will resume. But when that’s cut short, and when bulls are so aggressive to jump on that prior trend that pullbacks remain shallow and higher-lows show after a mild initial pullback, a bull pennant can build, such as we saw in the final two months of last year and then again for four months this year, right after gold hit the $3500 level.
But during each of those periods Bitcoin seemed to benefit, with the instance last year leading to BTC’s first ever test of the 100k handle and then this year’s bull pennant in gold leading to Bitcoin’s launch up to 120k. The question I asked two weeks ago was that with gold putting in a parabolic move over the 4k handle and looking more and more overbought from multiple vantage points, were we nearing another of those periods were digestion in gold made sense as anti-fiat flows drove into another market, such as Bitcoin.
BTC/USD Weekly Price Chart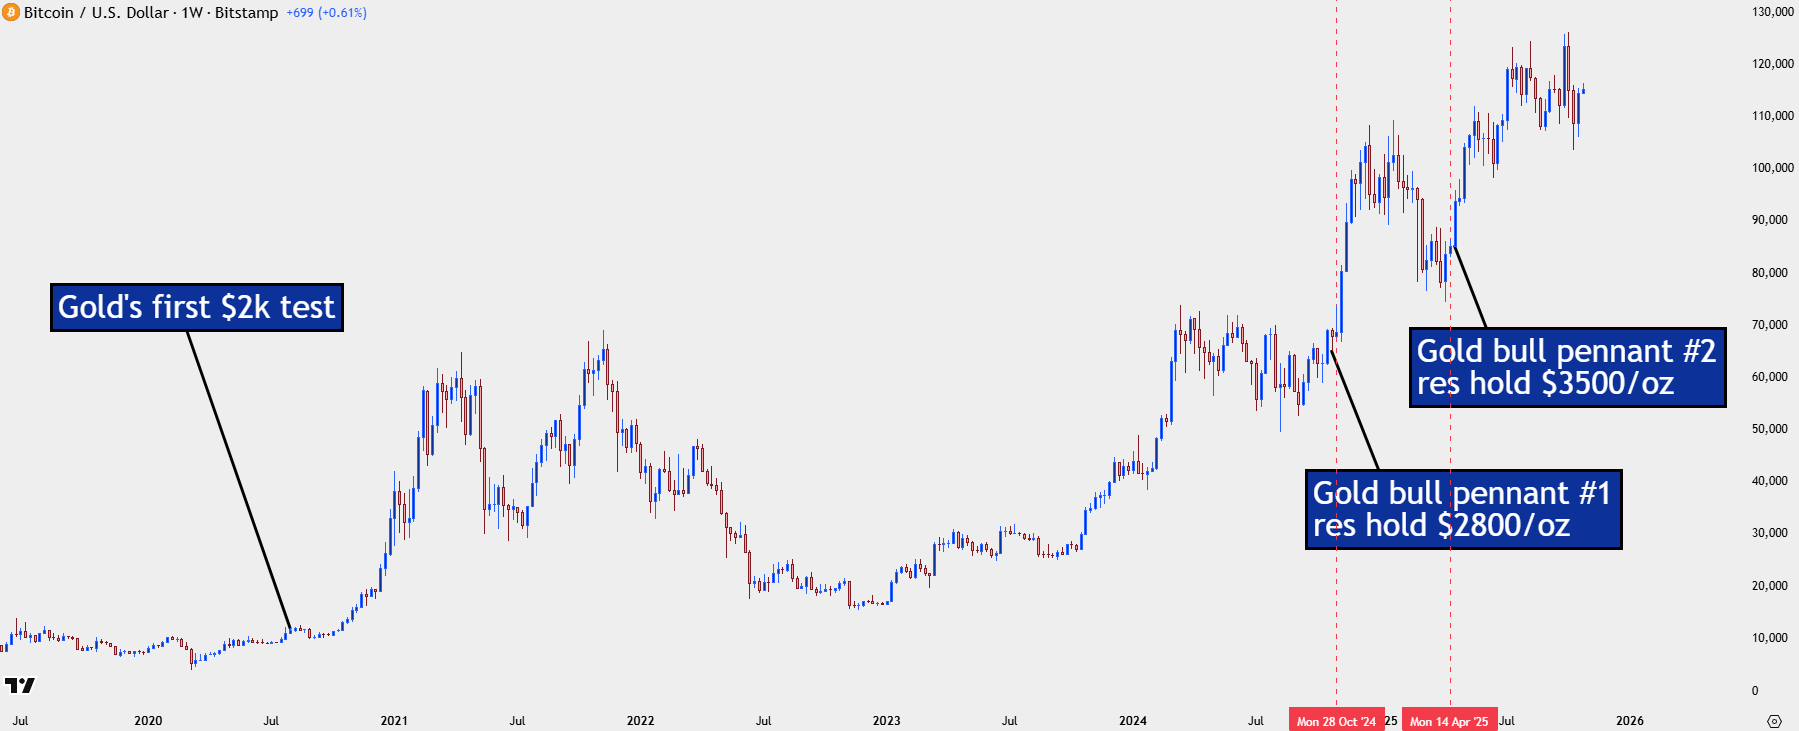
Chart prepared by James Stanley; data derived from Tradingview
The Driver
The driver behind both gold and Bitcoin is quite similar, and that’s capital flows leaving fiat currencies that are being pushed by the prospect of lower real rates. With inflation still relatively high and rate cuts taking hold in the United States, the prospect of avoiding that dilution grows more and more attractive. Also considering the ballooning government budgets around the world and it doesn’t seem like austerity and fiscal prudence is anywhere near.
This is likely why the initial spark behind this movement showed around that comment from Austan Goolsbee last February. At the time gold was struggling to hold the $2k level as support after having shown resistance there for the past three-plus years. It closed below that price only two days last year, triggered by a strong inflation print in February. But a day later the widely-watched Chicago Fed President implored markets not to get ‘flipped out’ about a single inflation print, even though it was more of a trend, and that deductively showed that the Fed probably wanted to cut rates even with inflation well above their own imposed 2% target.
That set gold on a massive rally that ran all the way into late-October, at which point digestion showed about a week ahead of the election, and that’s around the point that Bitcoin took over.
That made sense as President Trump had courted the Bitcoin crowd ahead of his election, and he had made acceptance of cryptocurrencies a part of his campaign platform. This led to an eventual move beyond the 100k level, with resistance finally showing around 105k. Interestingly it was during that massive rally in Bitcoin that gold had finally showed an element of digestion. And then as Bitcoin pulled back in February, March and April, gold again launched up to fresh highs in near-parabolic fashion, eventually hitting the $3500/oz level on April 21st.
As gold slumped from that high, Bitcoin broke out in a bit way, and this time it ran all the way up to the 120k level before finding sellers. That remains a key level as BTC/USD hasn’t yet shown acceptance above that price despite three different tests. And the question now is with gold in the process of pulling back and BTC showing initial signs of stability after holding support around prior resistance, is whether we may be on the cusp of another test above that big figure.
BTC/USD Daily Chart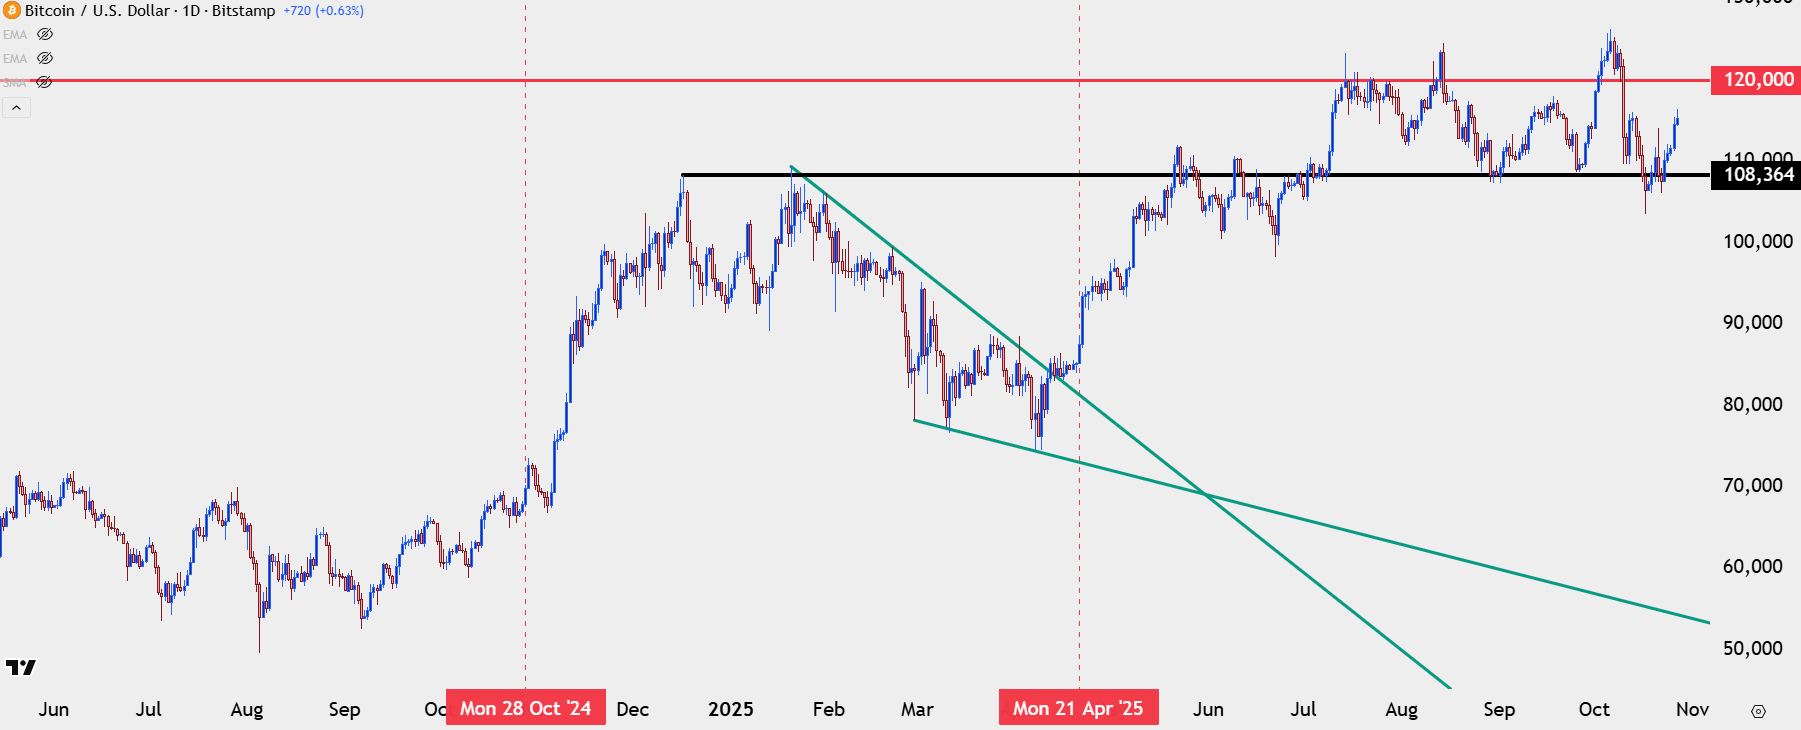
Chart prepared by James Stanley; data derived from Tradingview
From the above chart we can get some key data, such as the three days of failed tests at the 125k level, clearly showing that testing above that price brought in fresh sellers. We can also see the failed attempt from bulls to hold 120k as support, and that had the added thrust of the Trump threat of higher tariffs on China that pushed a risk-off move into a Friday.
There was also the attempted hold of support at 110k after that, which showed three days of support followed by a bounce, but sellers jumped on the 115k level until we got the eventual test of 105k.
It’s since then that the tide has been turning and the falling wedge developed from that support test has led into a bullish breakout, with another re-test of the 115k level. There’s still no confirmed acceptance above that price so traders would likely want to be cautious of chasing the move, instead, looking for higher-low support structure to allow for bullish continuation.
From the four-hour chart below, we can see an attempted push of support from buyers at that 115k price, but it’s still early so there’s nothing yet to confirm. A bit deeper, however, is a key swing level that’s been resistance a couple of times already but hasn’t yet shown as support, and that plots right around the 113,592 level. Below that, 112k is of interest, and then it’s the 110k level.
For invalidation I’m tracking the same swing level of 107,488 that helped to hold support and higher-lows twice last week, which means that 110k could similarly be an area of higher-low support potential if we do see BTC prices snap back a bit more.
BTC/USD Four-Hour Chart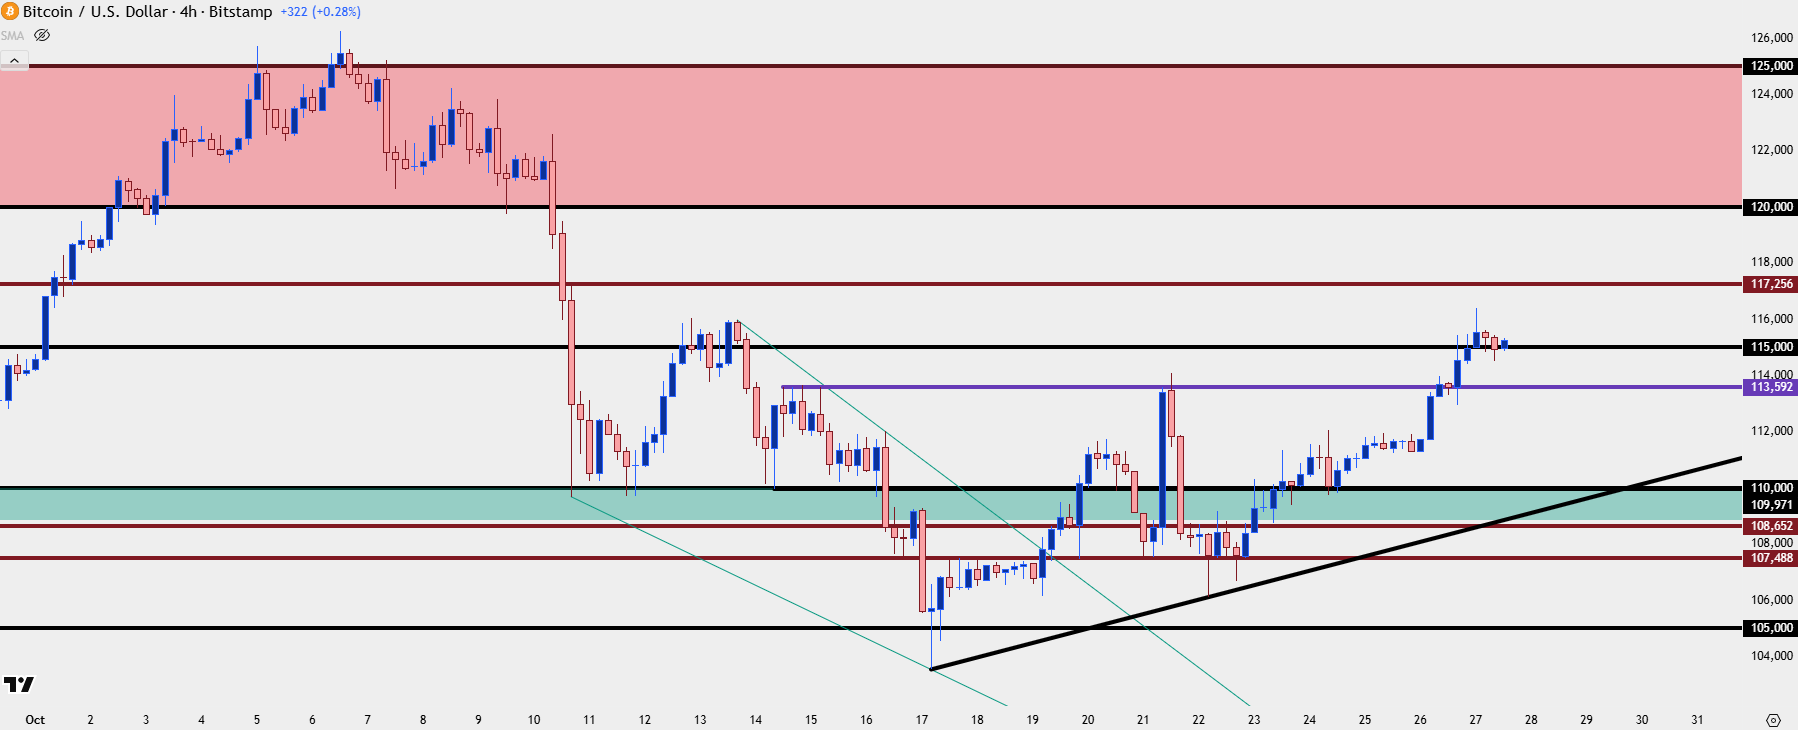
Chart prepared by James Stanley; data derived from Tradingview
--- written by James Stanley, Senior Strategist



