


Bitcoin shed more than $20k after the resistance hold at the $125,000, but a bounce showed up before sellers could push a re-test of the $100k psychological level and while the rally held in through the weekly open, a stunning turn showed yesterday with bears taking another shot today.

From the daily chart buyers still haven’t been able to re-take control after the resistance hold at the $125k level a few weeks ago. What started as a mild retracement turned into a full-fledged pullback after the Trump threat of increased tariffs on China, and BTC/USD still hasn’t recovered from that despite buyers taking a few shots at key spots on the chart.
Initially, it was the 110k level that provided a bounce. But, once again, a major psychological level came into play and tilted the flow with sellers driving down to another significant lower-low. This time, price pierced the 105k level albeit temporarily, and that led to a sizable bounce that ran through yesterday’s open.
But, once again, sellers showed up and offered prices back down, and at this point, that high from Tuesday takes on the appearance of a lower-high. There’s a couple of key levels remaining in-play that I had looked at in my last Bitcoin article, and I’ll dig deeper into that below.
BTC/USD Daily Chart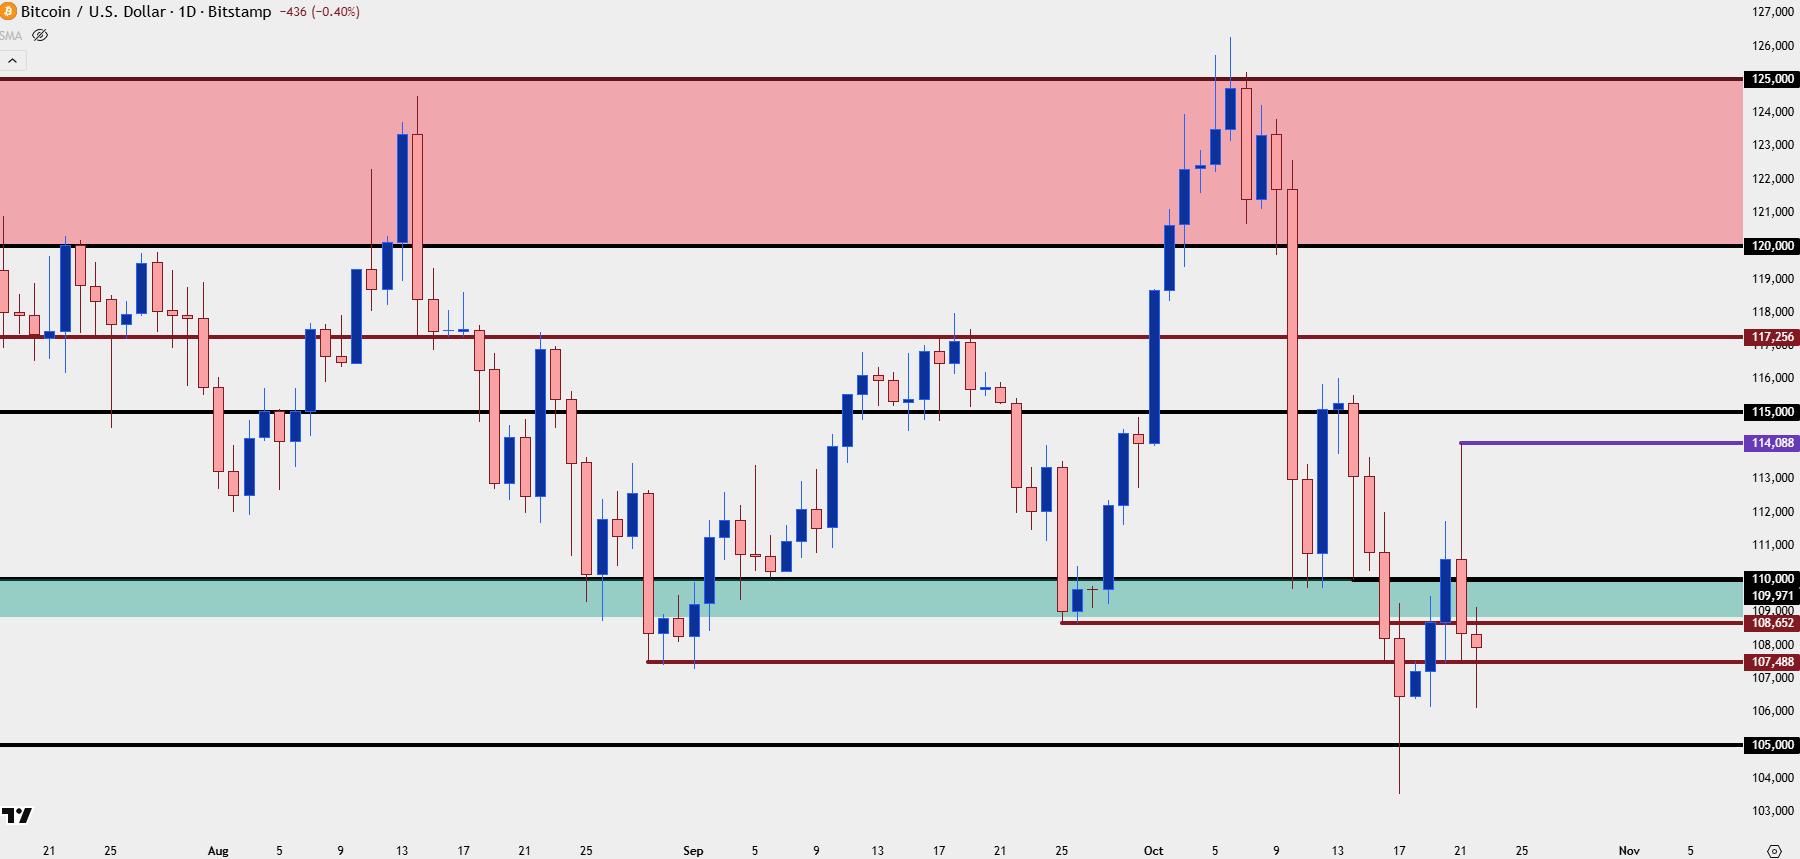
Chart prepared by James Stanley; data derived from Tradingview
BTC/USD Shorter-Term
When the move was breaking down, sellers remained aggressive at highs and less so as that 100k level came further into view. And as I noted in the Bitcoin article a couple of weeks ago, with a market like this where there are many long-term holders that will often look to new psychological levels, like 125k, as waypoints for profit taking, that dynamic can work in reverse, as well, as those that held on for a retracement down to 110 are compelled to take profits at 115. Fear and greed will constantly play a role but after another sweep shows and prices run down for another fresh low around the 105k level, that drive for profit taking can grow, which is at least likely part of the reason why we’ve seen a high develop inside of the 115k level with yesterday’s swing up to just over 114,000.
But, at this stage there’s been a build of support on a prior swing low at 107,488, and while it would still be far too early to call a low here, there is a building dynamic that could allow for a bounce to develop.
If buyers can reclaim the 110k level without piercing this morning’s low, the shorter-term look is going to start to take on a more bullish appearance, and in that scenario, a re-test of 115k becomes the next major item for buyers. Above that, I’m still tracking the prior swing of support-turned-resistance at 117,256 as a significant spot, but it’s the 120k and 125k levels where the recent drama has played out.
BTC/USD Four-Hour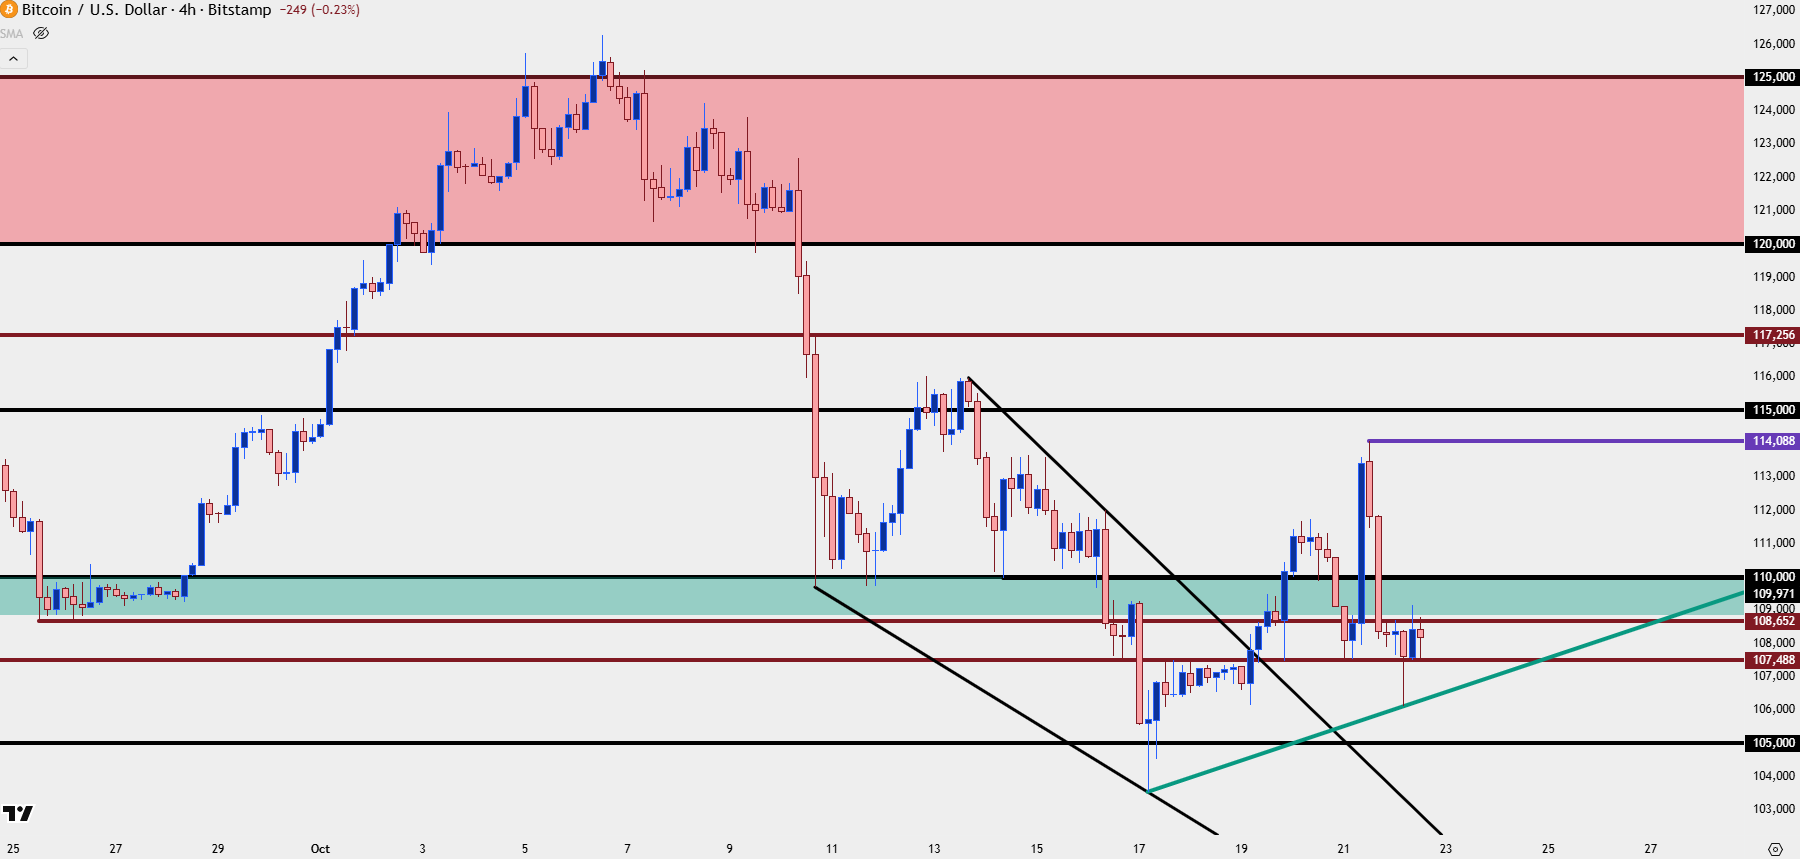
Chart prepared by James Stanley; data derived from Tradingview
--- written by James Stanley, Senior Strategist



