The week begins with a clear bearish bias in USD/CAD, posting a decline of around -0.31% in the short term. Selling pressure has remained consistent, driven by the recovery in the Canadian dollar following the release of inflation data in Canada, along with a growing sense of distrust toward the U.S. dollar. As long as these factors remain in place, selling pressure is likely to stay relevant in USD/CAD price action over the coming sessions.

Early inflation data begins to emerge
Earlier today, monthly and annual CPI data for Canada were released. Official figures showed a CPI m/m of -0.2%, compared to an expected -0.3%, while annual CPI came in at 2.4%, above the expected 2.2%, corresponding to December 2025. What stands out from these figures is that inflation does not yet show clear signs of a meaningful slowdown. On a year-over-year basis, the 2.4% reading remains above the 2.2% levels seen in October and November 2025, suggesting that inflationary pressure in Canada continues to be a relevant factor that could influence monetary policy decisions in the short term.
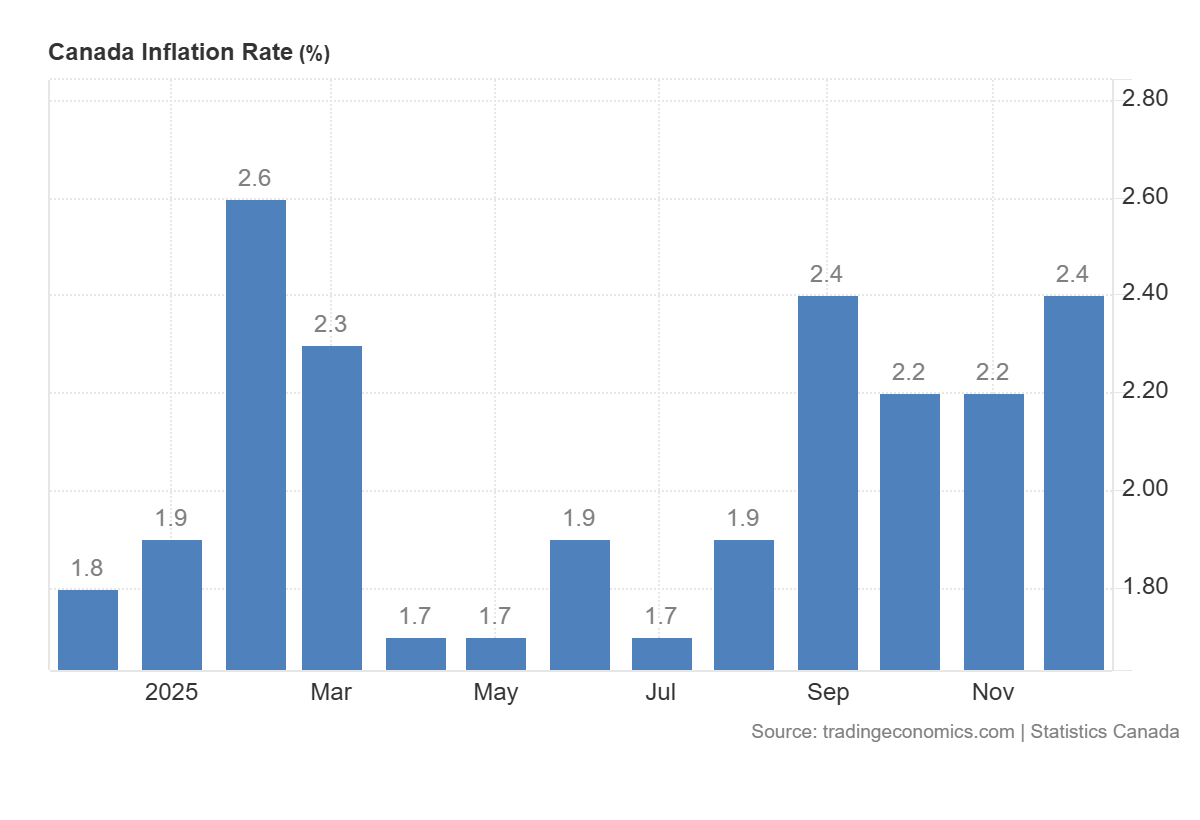
Source: TradingEconomics
In this context, it is worth recalling that the Bank of Canada has repeatedly stated that its monetary policy stance and the decision to maintain neutral interest rates largely depend on inflation dynamics. Based on the latest data, markets may anticipate that, at the January 28 meeting, the central bank will maintain a neutral policy stance, aiming to prevent inflation from accelerating further in the coming months.
This expectation is already beginning to be reflected in the fixed-income market. Canadian 10-year bond yields have rebounded toward the 3.4% area, once again showing a consistent upward slope. This behavior suggests that fixed-income markets are reacting to the prospect of a more neutral monetary policy outlook ahead of the next central bank decision.

Source: TradingEconomics
As the fixed-income market shows signs of recovery, this could encourage foreign capital inflows seeking exposure to Canadian assets, which in turn may support stronger demand for the Canadian dollar. If this scenario persists, current selling pressure on USD/CAD could intensify in the sessions ahead.
The U.S. dollar shows renewed weakness
Another relevant factor is the recent weakness in the U.S. dollar, linked to a short-term loss of confidence in the currency following announcements related to a possible reactivation of tariffs by the United States toward certain European countries. In this environment, the DXY index, which measures the dollar’s strength against its major peers, has developed a consistent downward slope, with price action approaching the 99-point level, highlighting a structural weakness in the currency.
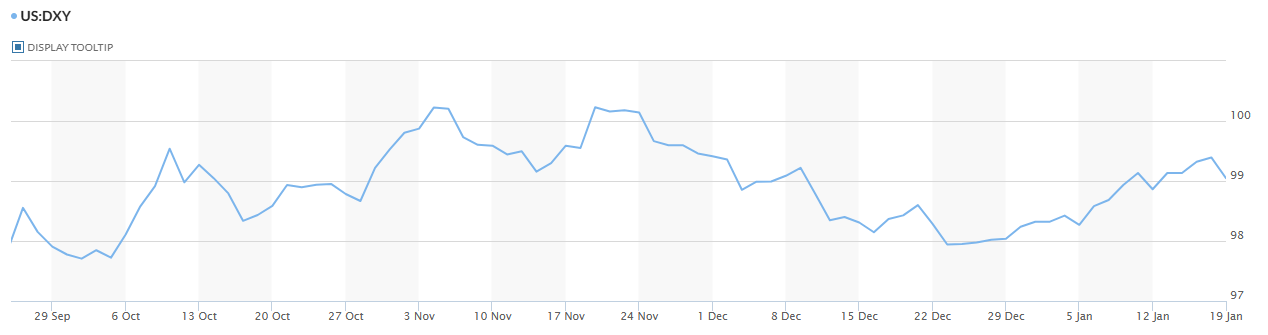
Source: Marketwatch
Given this backdrop, persistent U.S. dollar weakness may be facilitating a short-term recovery in the Canadian dollar. If the dollar continues to underperform in the coming sessions, the CAD could strengthen further, reinforcing sustained selling pressure in USD/CAD.
USD/CAD Technical Outlook
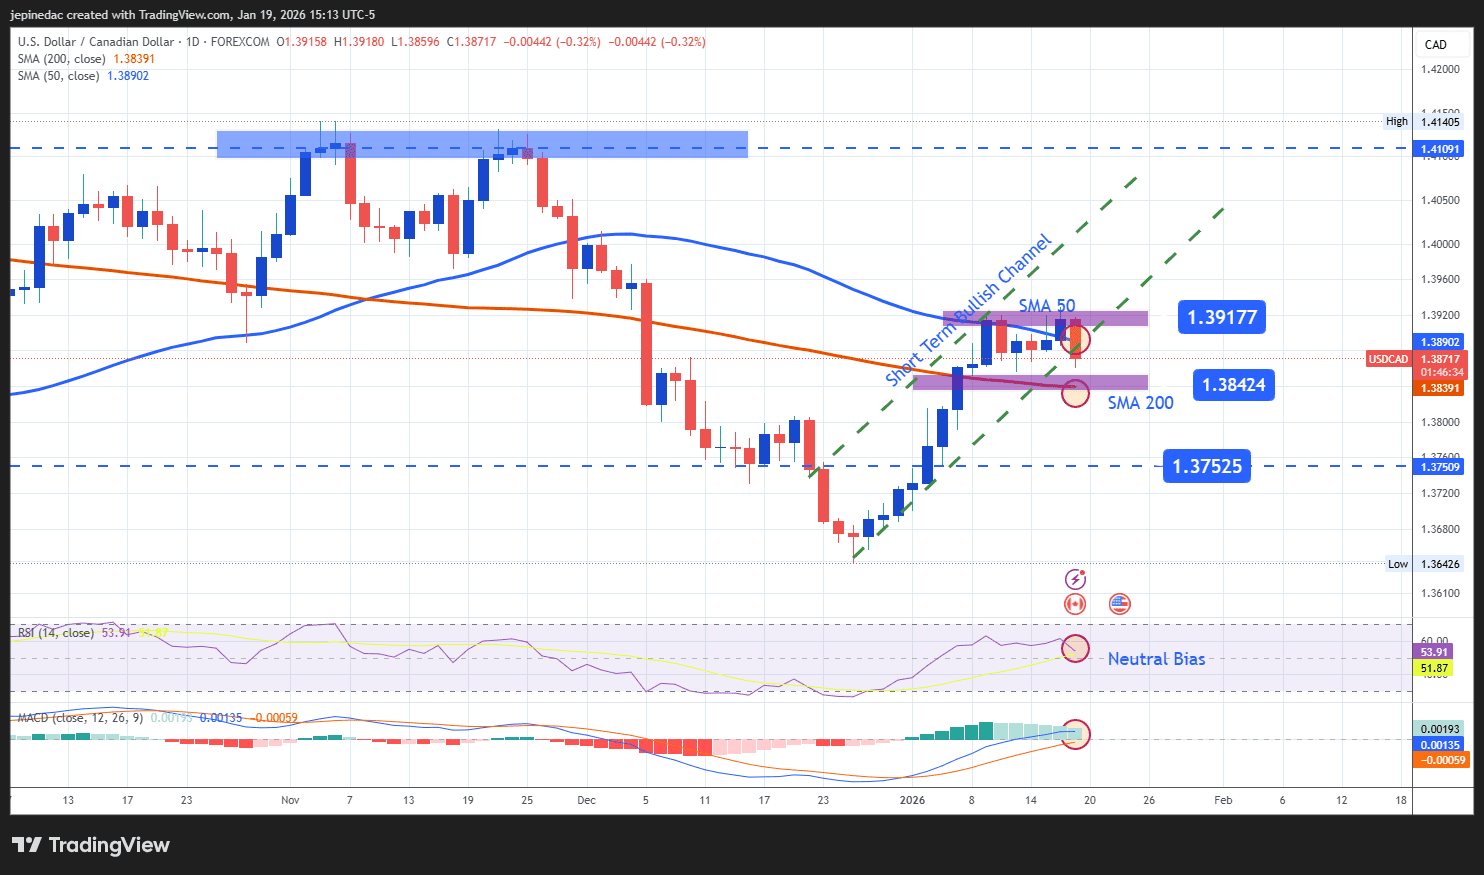
Source: StoneX, Tradingview
- Lack of clear direction begins to show in price action: Over recent months, USD/CAD had developed a gradual bullish move that was beginning to consolidate a potential ascending channel. However, in recent sessions, price action has entered a neutral phase, suggesting that bullish momentum has lost clarity. This behavior indicates that the pair could trade within a short-term range, as the market waits for a new catalyst to define the next directional move.
- RSI: The RSI remains oscillating near the neutral 50 level, indicating a balance between buying and selling forces. This setup points to a potential prolonged neutral scenario, which could translate into a period of indecision in the coming sessions.
- MACD: A similar scenario is visible in the MACD, with the histogram approaching the zero line, once again reflecting a balance in short-term moving averages. This pattern typically precedes consolidation phases or short-term indecision in price action.
Key levels:
- 1.39177 – Key resistance: This level aligns with recent highs and the 50-period simple moving average. Sustained moves above this area could reactivate the bullish channel and reinforce a more dominant bullish bias.
- 1.38424 – Current barrier: A nearby neutral zone, aligned with the 200-period simple moving average. Prolonged price action around this level could favor the development of a short-term sideways range.
- 1.37525 – Crucial support: This level coincides with a relevant consolidation area from recent weeks. A move toward this support could open the door to a new short-term bearish phase.
Written by Julian Pineda, CFA, CMT – Market Analyst
Follow him on: @julianpineda25