



In the Tuesday webinar for the past couple of weeks I’ve looked at USD/CAD as one of the more attractive major pairs for scenarios of USD-strength. And with both markets now vying for a bullish breakout, that remains the case.
The US Dollar opened the year near a big spot of support at the 98 handle on DXY, and we’re very close to that same level today. Of course, it hasn’t been a linear path as there’s been a few twists and turns, with an initial run of strength that was faded aggressively in January. But, more recently it’s been a route of recovery as DXY has clawed back to this key spot on the chart.
US Dollar Daily Chart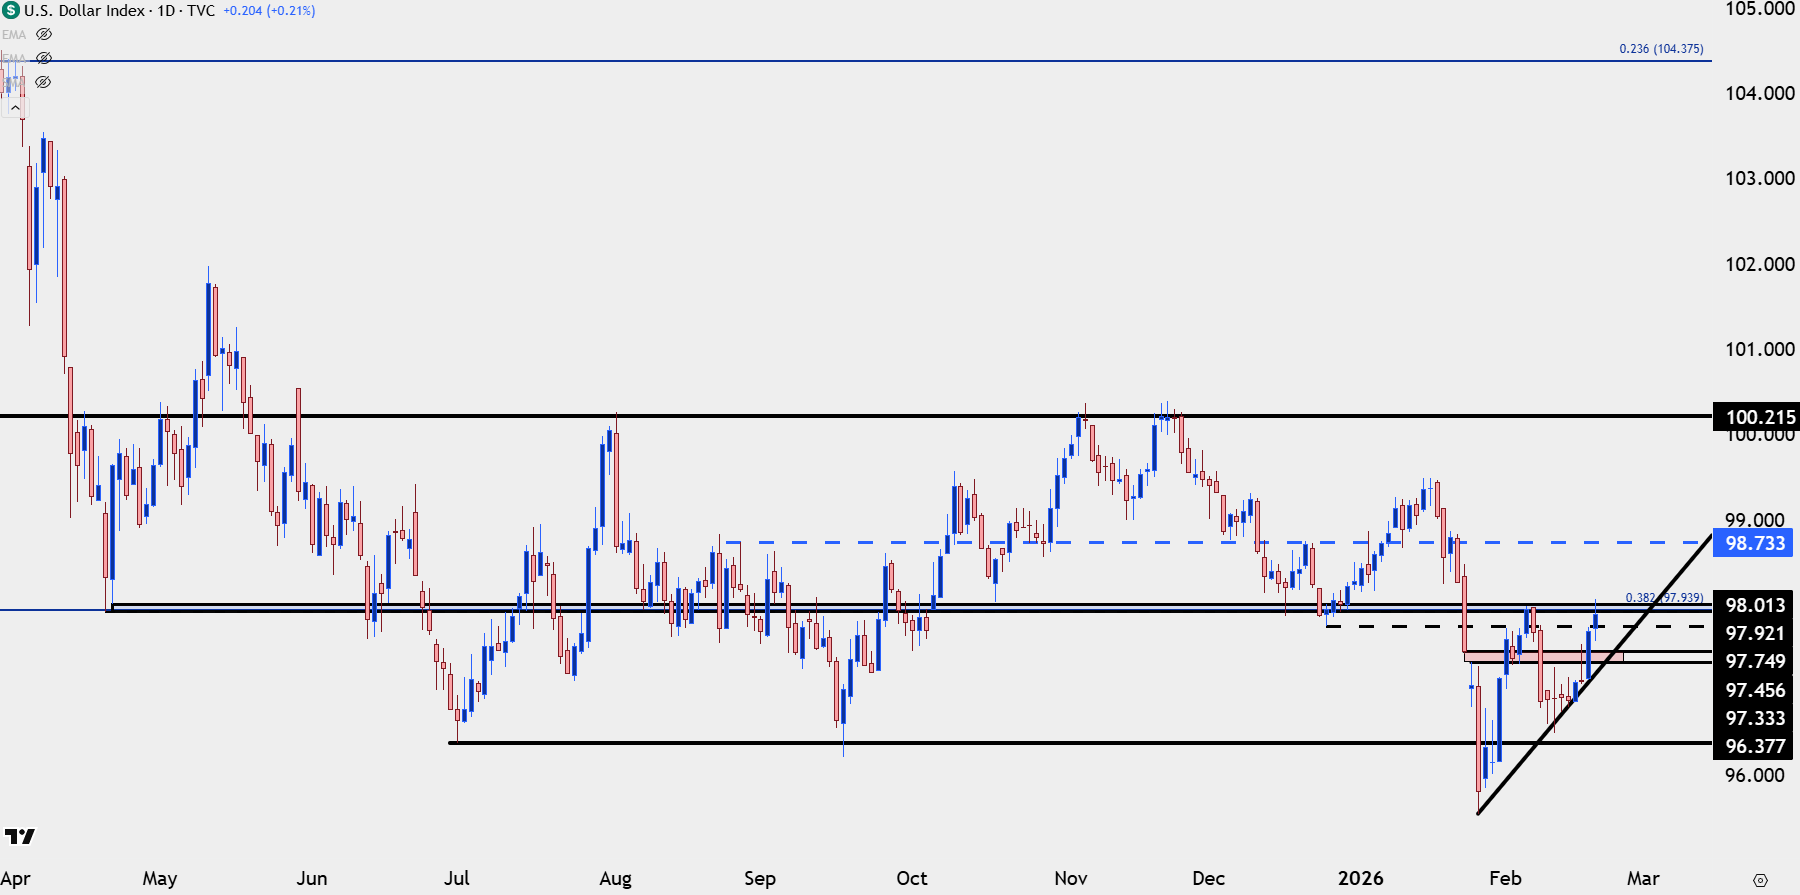
Chart prepared by James Stanley; data derived from Tradingview
USD/CAD for USD-Strength
A few weeks ago I began looking towards USD/CAD as one of the more attractive ways to work with USD-strength, largely on the basis of the longer-term structure in the pair. The 1.3500 level came into play in late-January and sellers were stifled as bulls showed up and helped to produce a bounce. Bears took another shot a couple weeks later but, again, were caught right around the big figure and there was even a hold of a higher-low, which has since been followed by a consistent week-plus of strength.
Now with the USD threatening a breakout at a big resistance level, so is USD/CAD at the 1.3700 handle.
USD/CAD Four-Hour Chart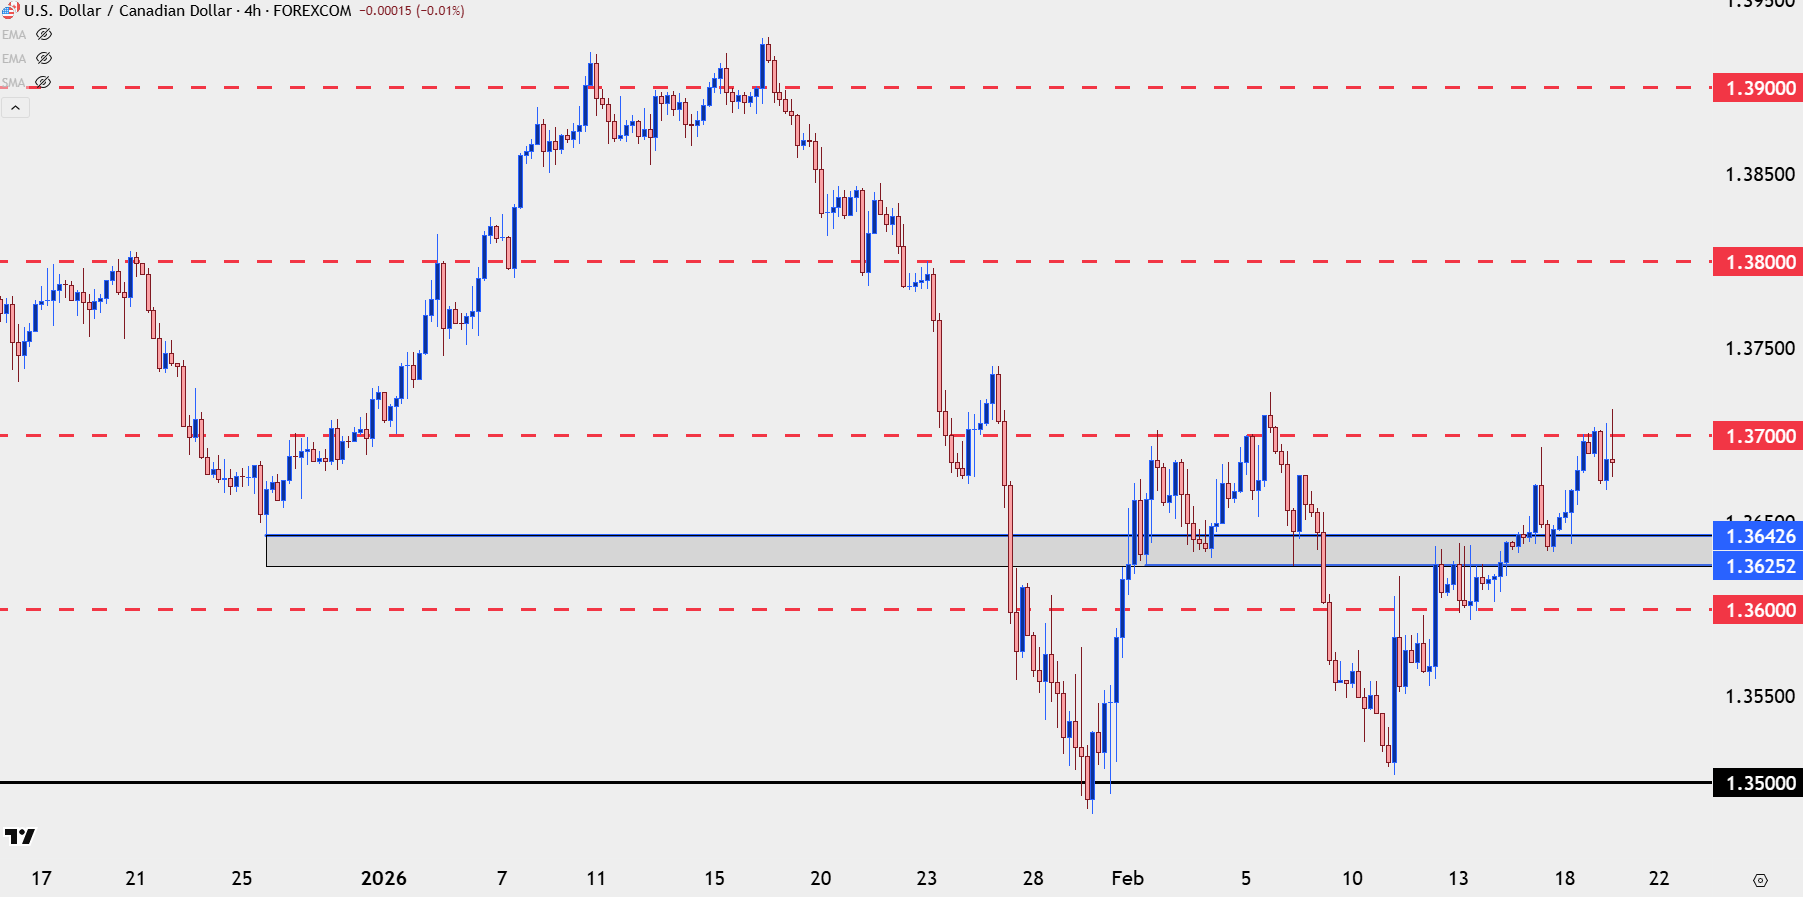
Chart prepared by James Stanley; data derived from Tradingview
USD/CAD Structure
While the shorter-term trend has taken on a bullish shape it’s the longer-term backdrop that’s probably most encouraging to longs, as there’s been a penchant for mean reversion in the pair and this was a big part of the basis for the analysis a few weeks ago, looking at the possibility of a turn in USD/CAD from the 1.3500 handle.
Last year saw similar jostling with the exception that 1.3500 didn’t come into play as bulls stepped in early, creating a grinding backdrop from June and through July that built an ascending triangle that eventually broke out to the upside and led to a run above the 1.4000 level.
As USD-weakness took hold in December USD/CAD showed a sizable sell-off, and reverted back towards that prior support but notably, there was a degree of relevance with prior price levels such as the 1.3925 prior point of resistance-turned-support that set the swing-high in early 2026 trade. And now we have a prior swing-low coming in as resistance a couple hundred pips below that around the 1.3727 level.
USD/CAD Daily Price Chart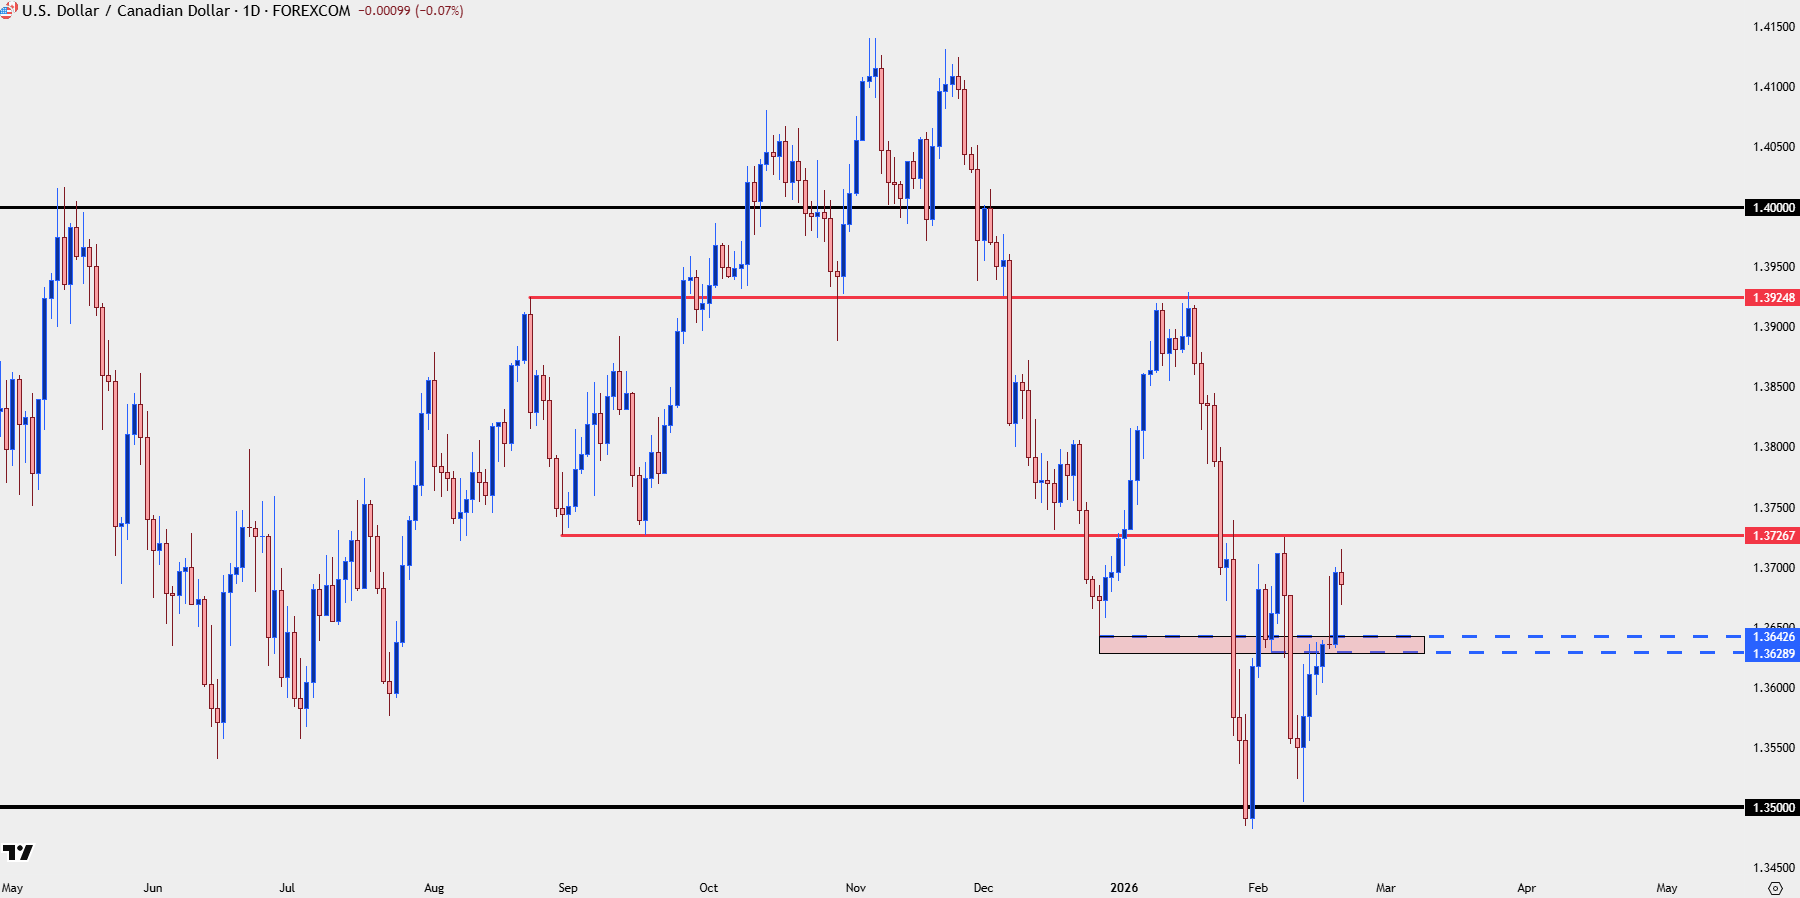
Chart prepared by James Stanley; data derived from Tradingview
--- written by James Stanley, Senior Market Analyst, Global Macro




