
USD/CAD has been a textbook of technical formations over the past four months as the pair reversed the aggressive sell-off from earlier in the year. The pair is now nearing the 1.4151-1.4178 zone that I’ve been talking about even before the ascending triangle breakout at 1.3750. This morning’s high is just 11 pips away from that zone and bulls remain in firm control following last week’s reversal at the 1.3900 handle.

Technical analysis is not predictive, I want to get that out up-front as I’m going to be referring to a few formations that have played out in a textbook fashion in USD/CAD over the past four months. The value in technical analysis, in my opinion, is in finding ways to implement strong risk-reward ratios, and that largely comes from support and resistance analysis. This can allow for the implementation of if-then statements, which can further allow for ways to risk a small outlay for a relatively larger reward if that if-then statement plays out.
But support and resistance isn’t the only lean of technical analysis that can produce value as there’s also trends. Trends often exist for a reason and it’s those reasons that usually steal the attention and the headlines and that’s what most people want to talk about. But to me, it’s the what that’s far more important than the why, and when there is a trend, it makes that idea of risking small for larger rewards even that much more attractive because that then provides for some element of motive for that support to hold or that resistance to remain.
Formations are another aspect that include both of those tenets: Like when we see a rigid horizontal level of resistance holding sellers at bay, with each inflection bringing a diminishing impact, leading to an upward sloping trendline. That makes for an ascending triangle formation and that’s usually approached with the aim of bullish breakouts, driven by the thought that the diminishing impact of that resistance will eventually allow bulls to push a breakout beyond that horizontal resistance.
In USD/CAD, that’s what built in June and July, with resistance holding at 1.3750 until bulls were finally able to push a breakout in late-July.
That’s what triggered the start of the reversal in USD/CAD, as the pair pushed up to fresh higher-highs even as the USD was driving down near three-year-lows.
USD/CAD Daily Price Chart
Chart prepared by James Stanley; data derived from Tradingview
After that breakout, there was a clear case of resistance turning into support, as there were three different support tests at prior horizontal resistance of 1.3750, with the last two holding at higher-lows. The last of those tests happened right when the Fed kicked off a rate cut cycle in September, and that was followed by a fast bullish trend that drove right through the psychological level at 1.4000.
That 1.4000 price is a big deal in USD/CAD, historically speaking. This marks the resistance side of a range that’s been ongoing for a decade now, and more recently, when 1.3750 first came in as support in May, it was 1.4000 that stopped the recovery with a clean test. There wasn’t a single daily close above that price, and sellers forced lower-highs before ultimately extending the sell-off.
But when on the way back up, bulls cut right through 1.4000 without even a pause. So, it’s perhaps no surprise that the pair started to look heavy above the big figure, allowing for the build of a rising wedge.
A rising wedge is a bit different from a triangle as the wedge has two trendlines with differing angles. Bulls are aggressively reacting to pullbacks and support while showing more trepidation at highs or near resistance. While the ascending triangle is approached for bullish breakout, the rising wedge is approached in the exact opposite manner, looking for bearish reversal, as the thought is that the trend is long-in-the-tooth and buyers are losing enthusiasm given the lacking drive at resistance or highs.
That’s what played out in USD/CAD through last week’s open, with price hurrying down to a familiar area of 1.3900 before finding support, at which point another formation showed up.
USD/CAD Four-Hour Price Chart
Chart prepared by James Stanley; data derived from Tradingview
Perhaps one of the more attractive parts of technical analysis is the objectivity element. As human beings it’s difficult to divorce ourselves from our own biases, but with technical analysis the case is rather clear.
Last Wednesday presents are clear illustration of this, where bears had made a striking move to breach the rising wedge and there were rate cuts from both the Bank of Canada and the Fed. But it was the reaction on Wednesday that started to show something of interest, and that was a big bounce from a prior level of resistance. The daily bar on Wednesday took on the tone of a dragonfly doji, illustrating a degree of indecision. This was followed by strength on Thursday which completed a morning star formation.
Morning star formations are often approached with aim of bullish reversal, hypothesizing that a sell-off from bar one met indecision on bar two, often because of a level of support coming into play. That’s then followed by reversal on bar three, and since that formation completed and confirmed last Friday, bulls have been in firm control of the pair with a push all the way up to that 1.4151-1.4178 zone which carries some longer-term connotations.
USD/CAD Daily Chart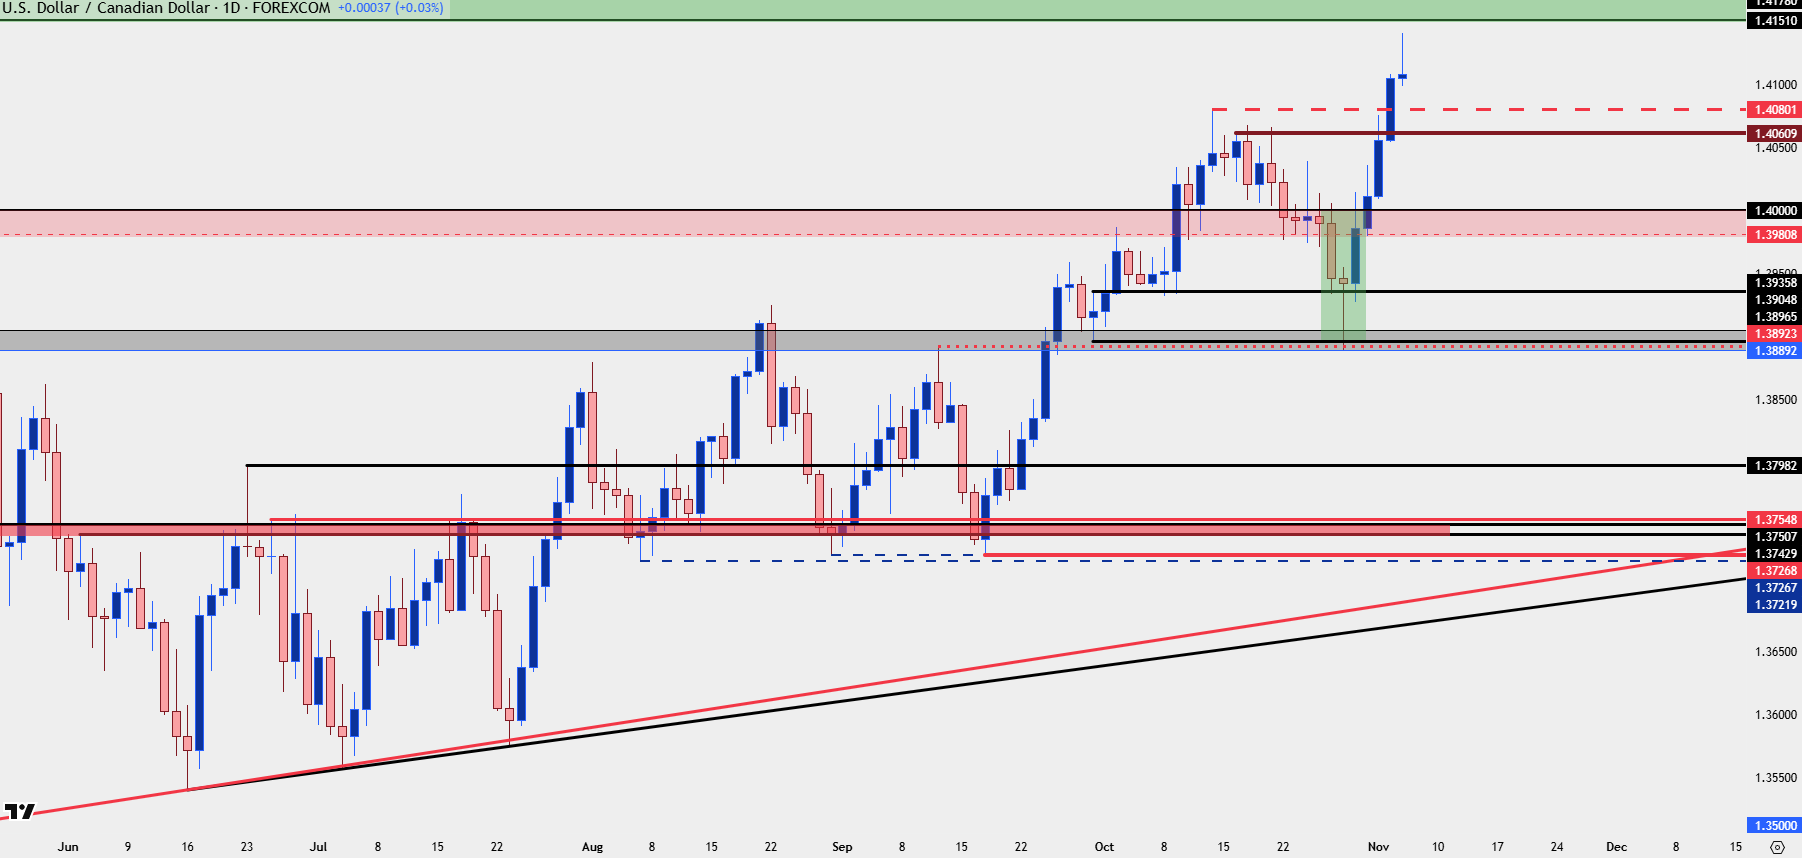
Chart prepared by James Stanley; data derived from Tradingview
USD/CAD Moving Forward
As I’ve been writing about for months now, that 1.4151-1.4178 zone could represent a big area of resistance for sellers to get back in the driver’s seat. That’s still speculative, however, as all that we have at this point, objectively speaking, is the massive rally from support that started a week ago. So, if looking to get bearish we’re going to need some pieces to fall into place first.
For now – bulls are large and in-charge and that 1.4000 area now represents an area for higher-low support. If we do get a pullback, that’s the spot that bulls need to defend to illustrate continued control, very similar to the mirror image episode of what happened in May when sellers defended the big figure.
Shorter-term there’s a couple of other levels of importance, each of which can serve as higher-low support, plotted at 1.4080, 1.4068 and 1.4034.
Until the daily chart presents a bearish reversal setup, it’s often best to try to go with the flow until there’s reason to suggest otherwise.
USD/CAD Daily Chart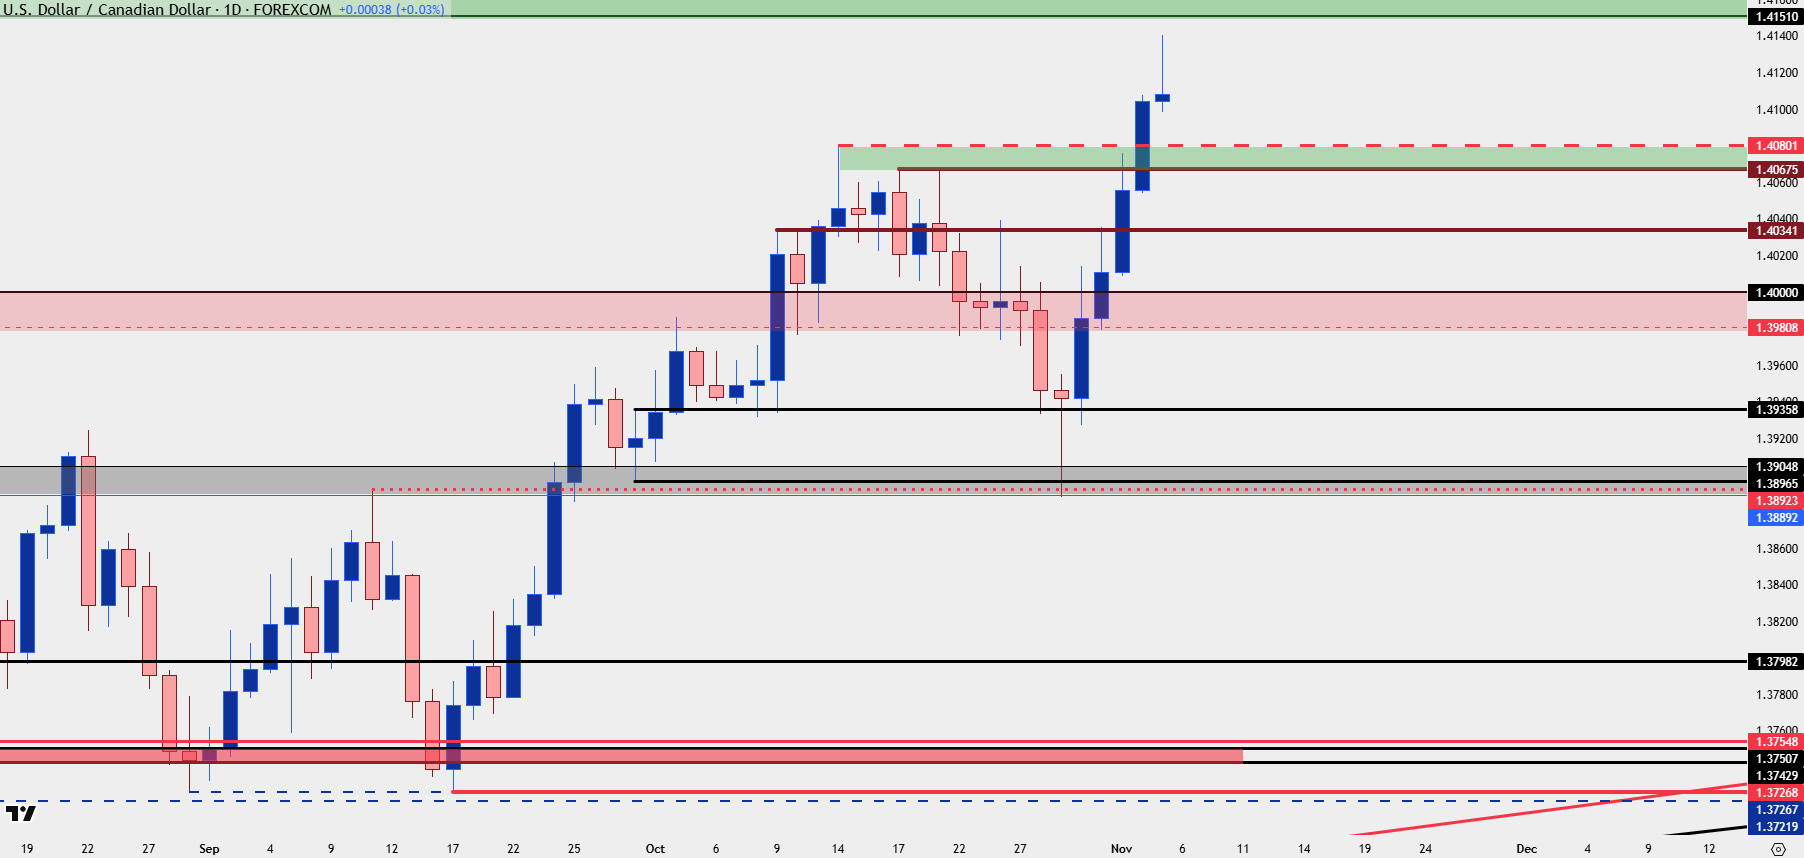
Chart prepared by James Stanley; data derived from Tradingview
--- written by James Stanley, Senior Strategist