
Key Events
- The March–April period appears to be a critical phase for markets on a yearly basis, from March 2020’s COVID shock to March 2026’s Middle East conflict
- The second year under a new presidential term historically leans bearish, following a first year of steep policy changes. Trump’s second year is now coinciding with rising geopolitical tensions
- The Strait of Hormuz, the passage for 20–30% of global oil and gas supply, remains central to market concerns, pushing WTI and Brent toward and above their 2025 peaks near 78 and 85
Second Year Under New Presidency Cycle

Source: Trading view
Following a pattern observed since 2006, the second year under a new presidency has often leaned toward consolidation or drawdowns, after a first year marked by aggressive policy shifts. In other words, it has historically served as a phase for markets to reset momentum before continuing their broader trend.
This year, however, downside risks are resurfacing across global indices, given the scale of the Middle East conflict and its direct impact on the Strait of Hormuz, energy markets, gas flows, and global inflation expectations, all under heightened war-driven risk sentiment, unless bullish zones are reclaimed.

Recent headlines have introduced possible peace negotiations, sharply swinging sentiment and crude oil prices. WTI reached the 2025 peaks near 78 before pulling back toward 75. Meanwhile, US indices are holding relatively stable compared to their yearly highs near 48,600 for the Dow and 25,000 for the Nasdaq.
On one side, AI-related concerns and political headwinds persist. On the other, the Middle East conflict and partial disruption at the Strait of Hormuz continue to shape the energy narrative. A closer look at crude oil through WTI, Brent, and XLE helps assess potential inflation and energy disruption risks globally.
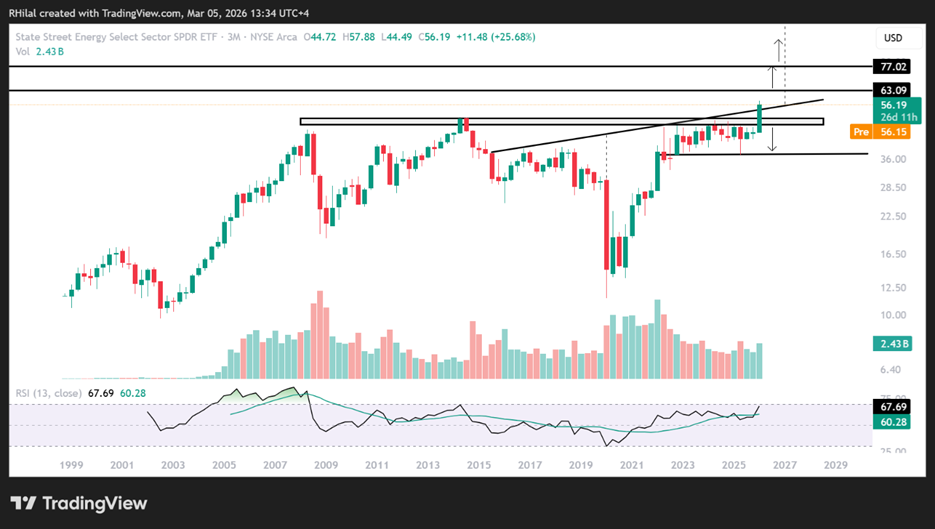
Energy Select Sector ETF – 3 Month Time Frame – Log Scale
Source: Trading view
The three-month time frame helps reduce noise and highlights the bullish momentum that has been building since the December 2025 lows. From an ETF perspective, price action broke to multi-decade highs above the 50 zone, hinting at a possible inverted head-and-shoulders formation developing between 2015 and 2026.
If price action holds above the 60 zone, further upside risks aligned with geopolitical escalation remain on the table. A close back below the 50–48 zone would ease energy and inflation pressures and soften the broader downside outlook for global markets.
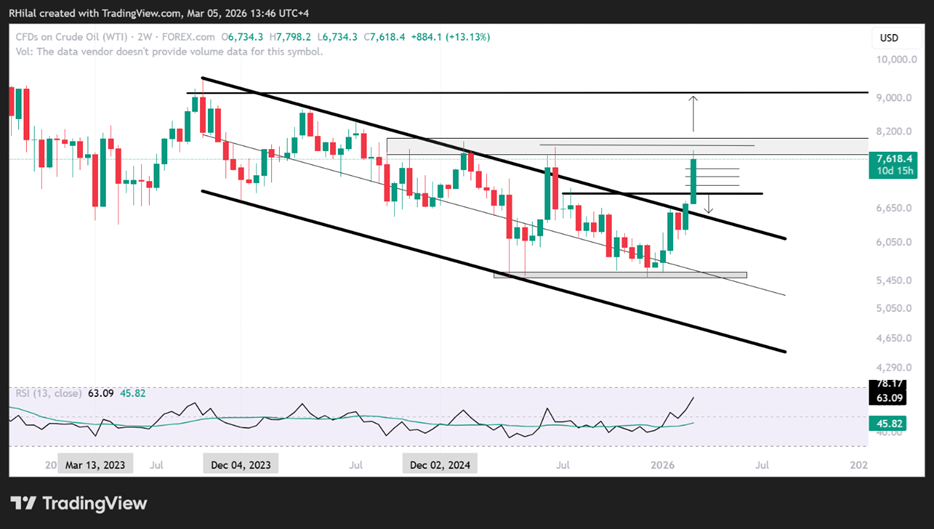
WTI Crude Oil Outlook: 2 Week Time Frame – Log Scale
Source: Trading view
The two-week time frame puts price action into broader perspective as it tests the 2025 highs near the 78–80 zone. A close above 80 opens wider bullish potential, targeting the 2023 highs near 90 dollars per barrel, before potentially revisiting the 100 threshold.
On the downside, a close back below 74 and 72 would ease global energy pressures, particularly if supply flows normalize. A break below 69 and 67 would expose renewed bearish bias toward the 60s, especially if supply glut dynamics regain focus beyond the Middle East conflict.
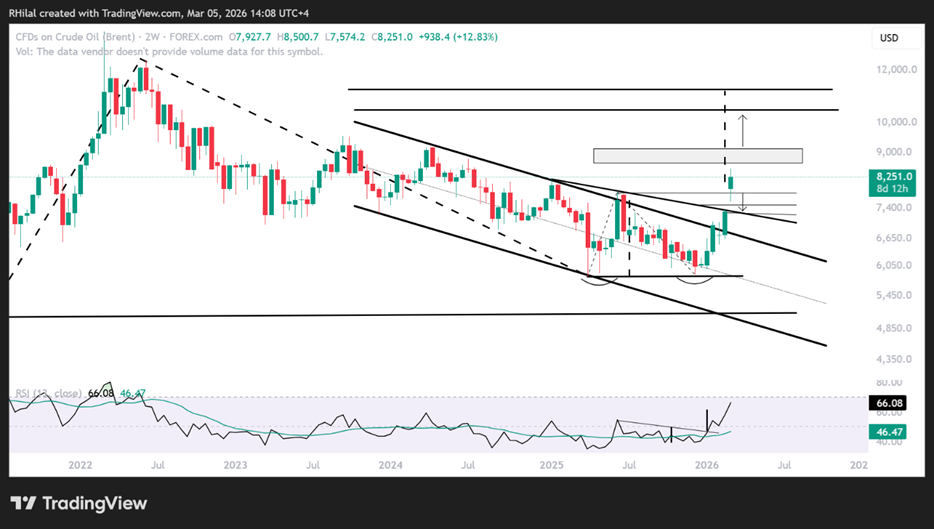
Brent UK Oil Outlook: 2 Week Time Frame – Log Scale
Source: Trading view
Unlike WTI, Brent is revisiting highs last seen in 2024, progressing above the June 2025 and January 2025 peaks and trading above the 82 mark. Upside projections, derived from Fibonacci extensions using the 2020 lows, 2023 highs, and 2026 lows, place the next potential targets near 91 and 105.
If tensions ease and prices fall back below the 80 zone, key support levels emerge near 78, 75, and 72. A sustained move below those levels would confirm a broader bearish bias back toward the 60s range.
Headlines can shift rapidly between escalation and peace negotiations. Long-term key levels remain critical in confirming trend continuation or reversal. A sustained bullish scenario in energy would likely pressure global currencies and equities through inflationary effects, and vice versa.
Written by Razan Hilal, CMT
Follow on X: @Rh_waves