
The second week of May is coming to an end, and although some cryptocurrencies, such as Bitcoin, attempted to show buying strength at the beginning of the trading week, this move was not enough to maintain the market’s bullish bias. Neutrality has taken over price action toward the end of the week, even in Bitcoin, which, as the market’s reference asset, has not managed to stabilize above the 80k psychological level. This has resulted in broader indecision across the crypto market, which could remain relevant during the coming trading sessions.

Performance of major cryptocurrencies
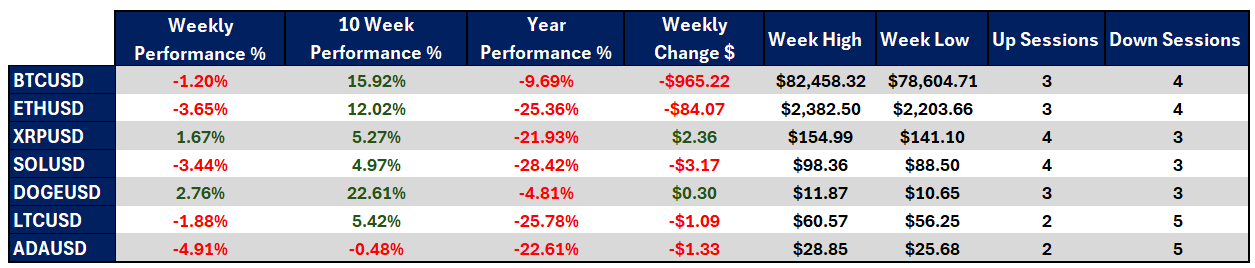
Source: Data - StoneX, Tradingview
- The cryptocurrency that showed the most short-term stability was Dogecoin, with a weekly gain of +2.76%, while Cardano was once again the most affected, with a decline of nearly -5.00%. Overall, the week showed mixed performance, with some cryptocurrencies trying to hold strength while the rest of the market moved between weakness and neutrality.
- Over the past ten weeks, the market has managed to maintain positive medium-term performance. In this scenario, Dogecoin once again stands out, with gains above 22%, while Cardano continues to show relative weakness. This positions DOGE as one of the most stable cryptocurrencies in both the short and medium term.
- Year-to-date, the market still faces an important challenge, as none of the major cryptocurrencies have managed to move above their 2026 opening prices. Solana remains the most affected, with a decline of -28.02%, while Dogecoin stands out again for its relative stability, with a decline of only -0.48%.
- Bitcoin, as the market benchmark, once again showed significant neutrality. Although price managed to move above the psychological 80k level at one point, it failed to hold consistently above that area, reflecting that the market’s leading cryptocurrency is still facing a phase of indecision.
- Overall, most of the market continues to reflect consistent short-term neutrality, with weakness becoming increasingly evident. As long as no relevant new highs are observed, this environment could continue to favor the formation of sideways ranges during the coming sessions.
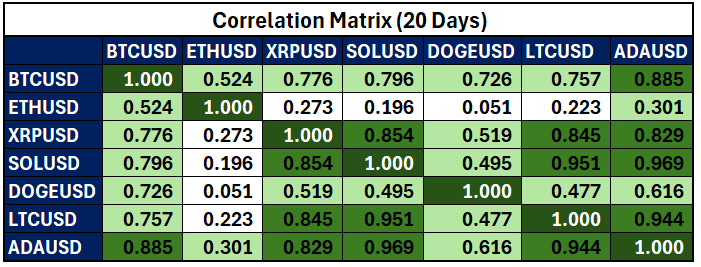
Color scale from red to green – Red for negative correlations and green for positive correlations
Source: Data - StoneX, Tradingview
From a correlation standpoint, a loss of synchronization between major cryptocurrencies and Bitcoin continues to stand out. In most cases, positive correlation coefficients are approaching the 0.7 area, while in Ethereum they remain close to 0.5, showing that although correlations remain positive, the similarity with Bitcoin’s movements has lost relevance. It is important to remember that these coefficients can change over time.
This behavior reflects a mixed market dynamic, where recoveries have appeared more as isolated cases than as a broad market move. Bitcoin has not been able to sustain enough confidence to drive broader demand, suggesting that crypto appetite remains concentrated in specific assets.
In this context, although some assets have shown improvement, more consistent alignment is still needed for the recovery to become stable. If the market does not regain synchronization, mixed data could continue to reflect a generalized neutrality bias during the coming trading sessions.
Neutrality begins to become evident in BTC
Source: StoneX, Tradingview
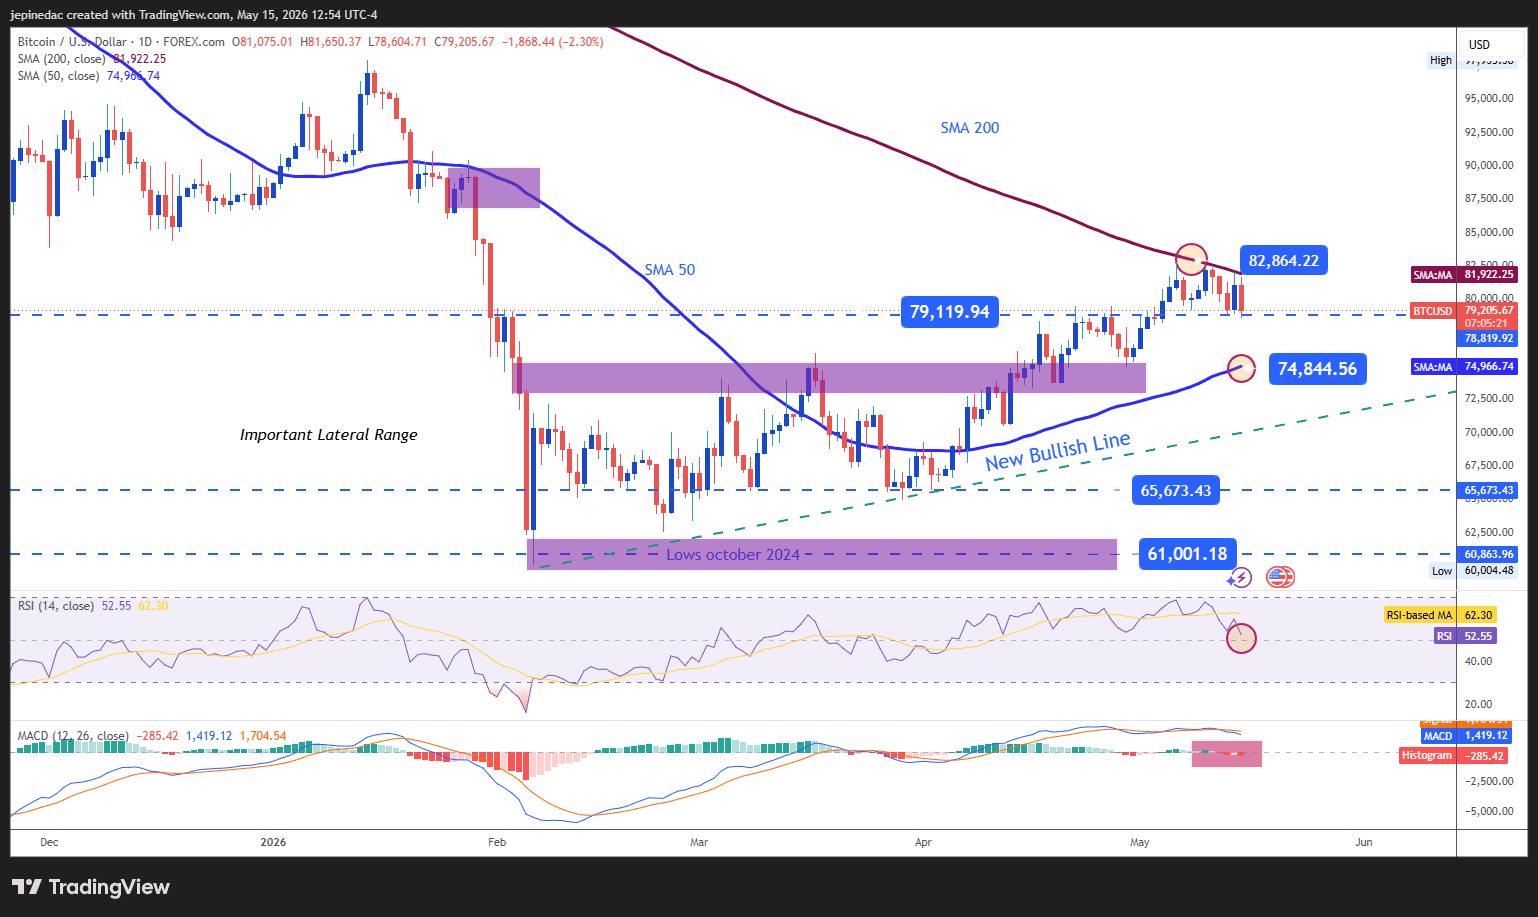
Although a relevant bullish trendline remains in place in BTC’s average price action, the recent price recovery has not been strong enough to stabilize above the 80k area. This shows that consistent neutrality is becoming increasingly relevant in the short term. Therefore, even though the bullish trendline remains dominant, this neutrality could still lead to a potential short-term sideways range in BTC price action over the coming sessions.
Indicators:
- Now, RSI movements have started to approach the neutral 50 line, and a similar dynamic is taking place in the MACD histogram, which is also moving near the 0 line. This indicates that both average momentum and short-term moving average strength have started to move into a more neutral environment, potentially pointing to a relevant phase of indecision for Bitcoin in the coming sessions.
Key levels:
- 82,800 USD – Important resistance: A relevant high area that coincides with the 200-period simple moving average. Bullish moves above this zone could reflect a clearer structural shift on the chart and give way to a dominant buying bias that continues to extend the new bullish trendline.
- 74,800 USD – Near-term barrier: A consistent neutral level aligned with the 50-period simple moving average barrier. If price starts to move too close to this area without relevant directional moves, stronger neutrality could begin to dominate short-term price action and even open the door to the formation of a sideways range.
- 65,670 USD – Definitive support: A zone of relevant lows that acts as the main downside barrier. Moves toward this level could put the current bullish trend line at risk and give way to a potential selling bias, which could become relevant over the following weeks of trading.
Dogecoin positions itself as the most stable cryptocurrency
Source: StoneX, Tradingview
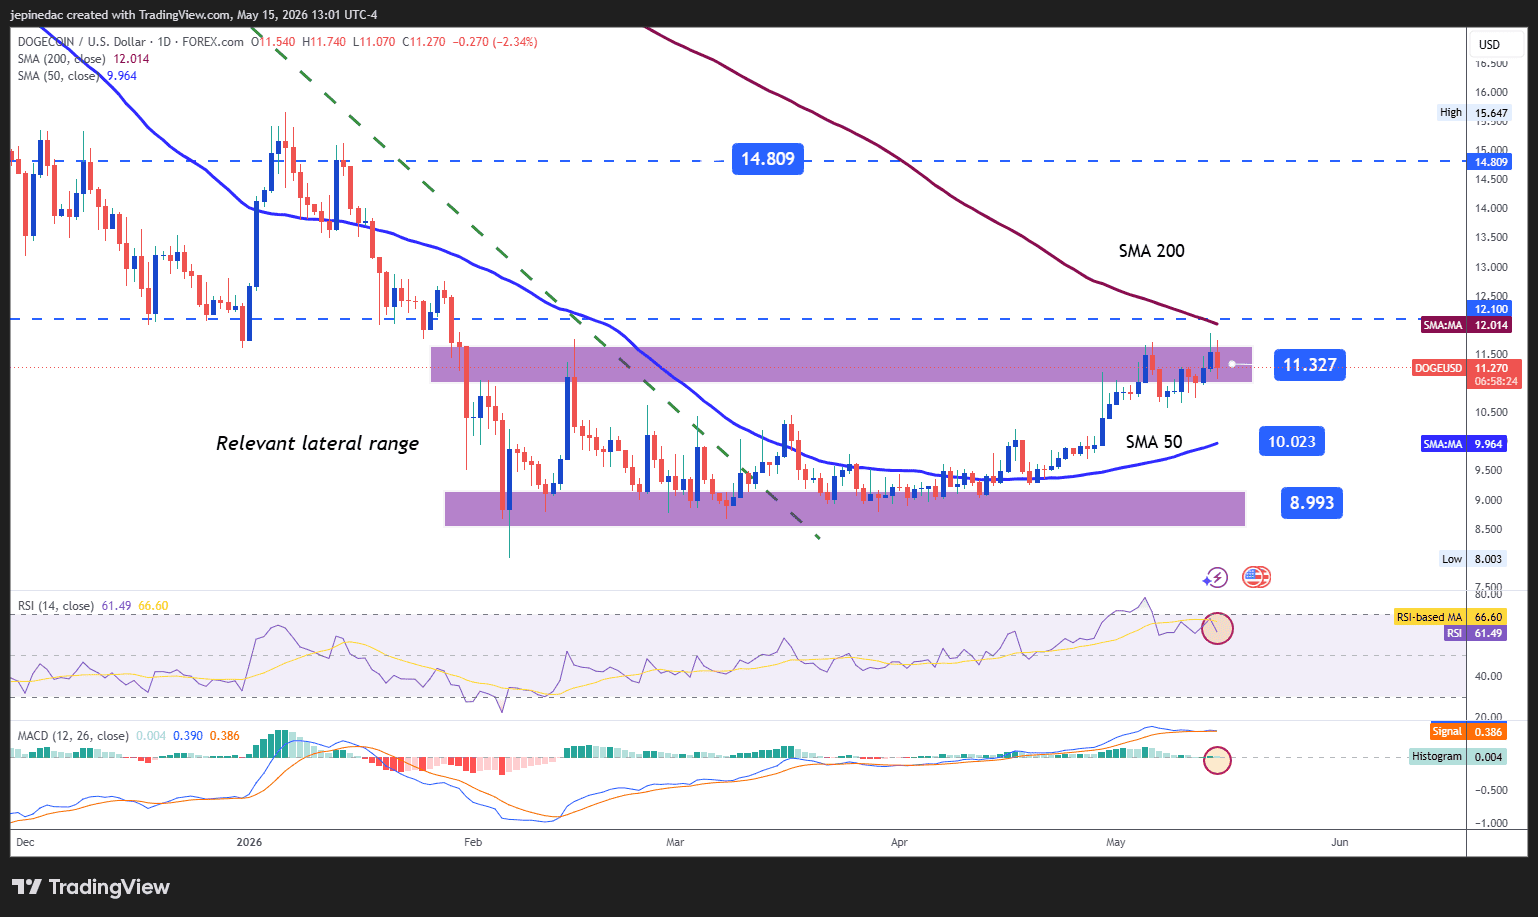
Dogecoin has started to stand out as the cryptocurrency showing the most stability in short-term price action. In fact, the recent price recovery is now facing an important sideways range that has dominated price movements over the past several weeks. If buying pressure manages to hold in the short term, this could lead to a breakout of the sideways range and the potential formation of a more structured bullish setup, which could become relevant over the coming weeks of trading.
Indicators:
- Now, the MACD shows a histogram very close to the 0 line, suggesting balance in the strength of short-term moving averages. This highlights that neutrality has not fully disappeared from the market. However, looking at the RSI, its movements remain above the 50 level, suggesting that, on average over the last 14 sessions, bullish momentum remains relevant. This points to the possibility that buying strength could remain active and potentially bring some surprises during the coming sessions.
Key levels:
- 11.32 – Important resistance: This level corresponds to the upper boundary of the current sideways range on the chart and aligns with the barrier marked by the 200-period moving average. Price action that manages to break above this level could give way to a more relevant buying bias and a possible bullish trendline formation over the coming weeks.
- 10.02 – Near-term barrier: A relevant neutral level aligned with the barrier marked by the 50-period simple moving average. Price action that remains too close to this level could generate important neutrality pressures, extending the current sideways range in the short term.
- 8.99 – Main support: A 2026 low that corresponds to the most important downside barrier to watch. Price action attempting to return to this level in the short term could reactivate a relevant selling bias, which could dominate Dogecoin’s movements in the medium term and eliminate the possibility of a new bullish trendline.
Written by Julian Pineda, CFA, CMT – Market Analyst
Follow him on: @julianpineda25