


Euro Forecast: EUR/USD
EUR/USD has sequenced a clean series of lower-lows and highs since the FOMC rate cut on September 17th. But this week’s test of 1.1500 pulled bears back, and the question now is whether the sell-off can gain traction below the big figure that’s historically been a big sticking point in the pair.
For next week I’m looking at the broader trend of strength in the USD which lines up with weakness in EUR/USD. But we’re already at a big spot in EUR/USD with the 1.1593 Fibonacci level being tested, and there’s another two areas of interest overhead that could invalidate the short-side trend if they’re broken through in early trade next week.
The 1.1500 level holds historical importance in EUR/USD and that story draws back to a decade ago when EUR/USD was range bound for more than two years in an approximate 1,000 pip range that was cut off at resistance by the 1.1500 handle. As the Fed hiked rates in 2019 EUR/USD grinded back below but when Covid came into the picture, it was 1.1500 that capped the highs. And then when the Fed was preparing to go back into a rate-hike campaign, 1.1500 was the last look of lower-high resistance before sellers drove a dramatic sell-off.
More recently, that price held the highs in April as resistance and then shorter-term, as support on August 1st.
That price is what came into play as support last week and as I had highlighted in the Tuesday webinar, I would’ve been surprised if sellers were able to just cut right through that price without any element of pullback.
EUR/USD Monthly Chart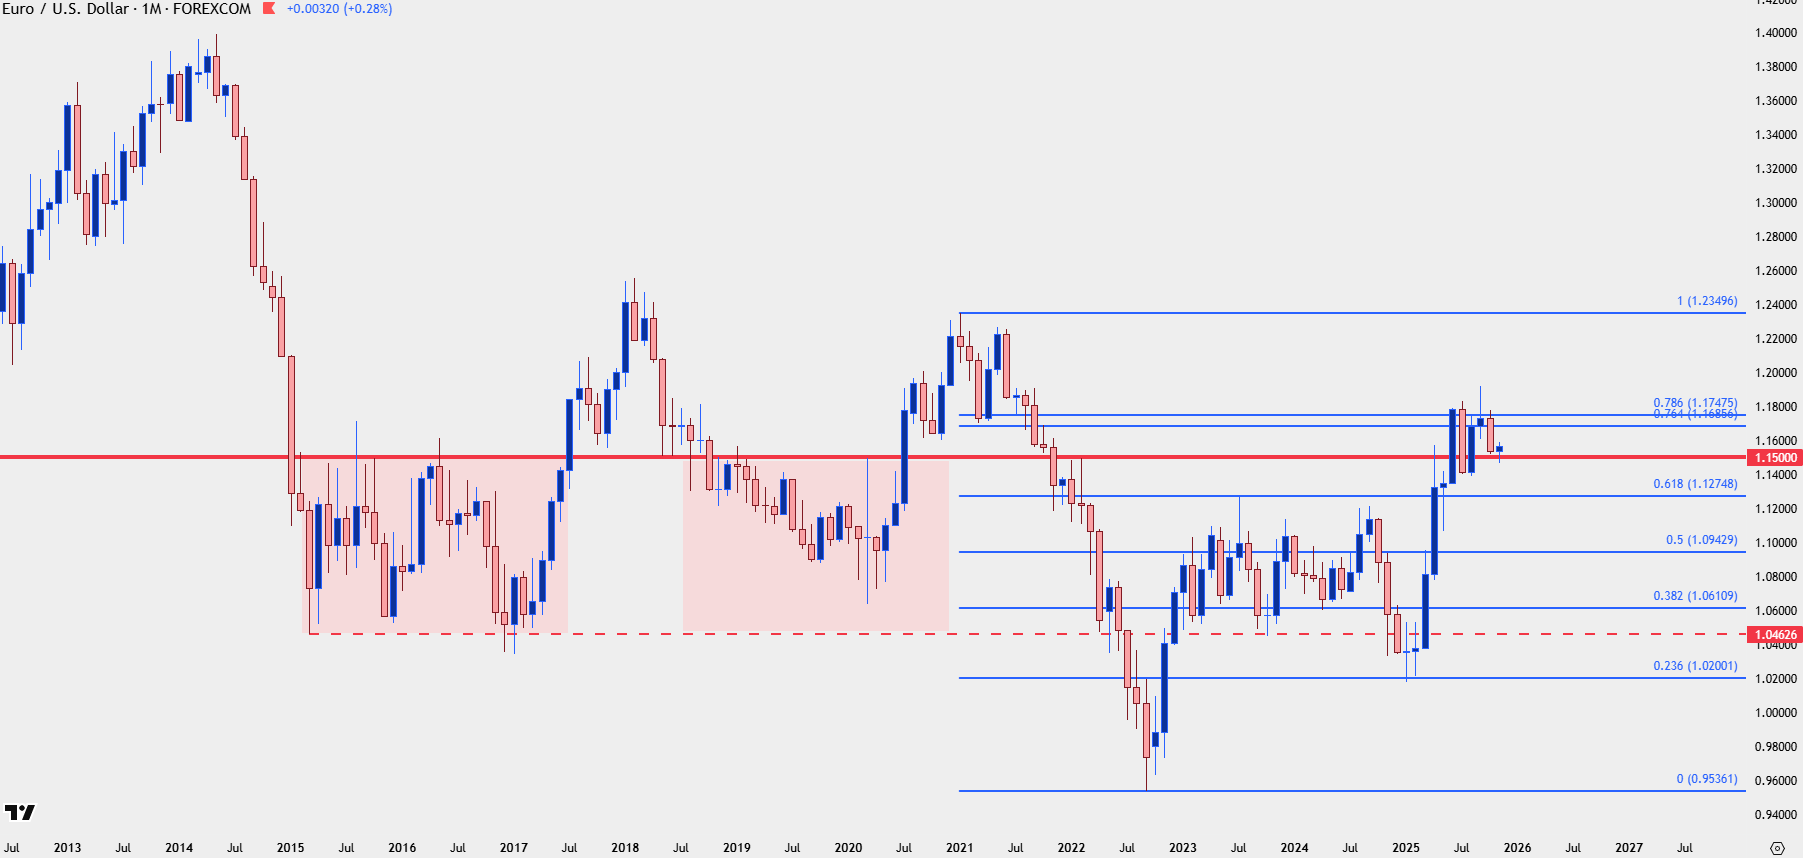
Chart prepared by James Stanley; data derived from Tradingview
EUR/USD
The weekly chart adds some additional insight as the Fibonacci retracement produced by the 2021-2022 major move has continued to hold resistance at the 76.4-78.6% levels. Those started to come into play in June and initially led to a test below 1.1500, which quickly snapped back. But when bulls had an open door to run they failed to do so, including the episode where a fresh three-year high was set at the Fed’s rate cut announcement on September 17th.
Since then, it’s been lower-lows and lower-highs that’s led to the 1.1500 test last week.

EUR/USD Weekly Chart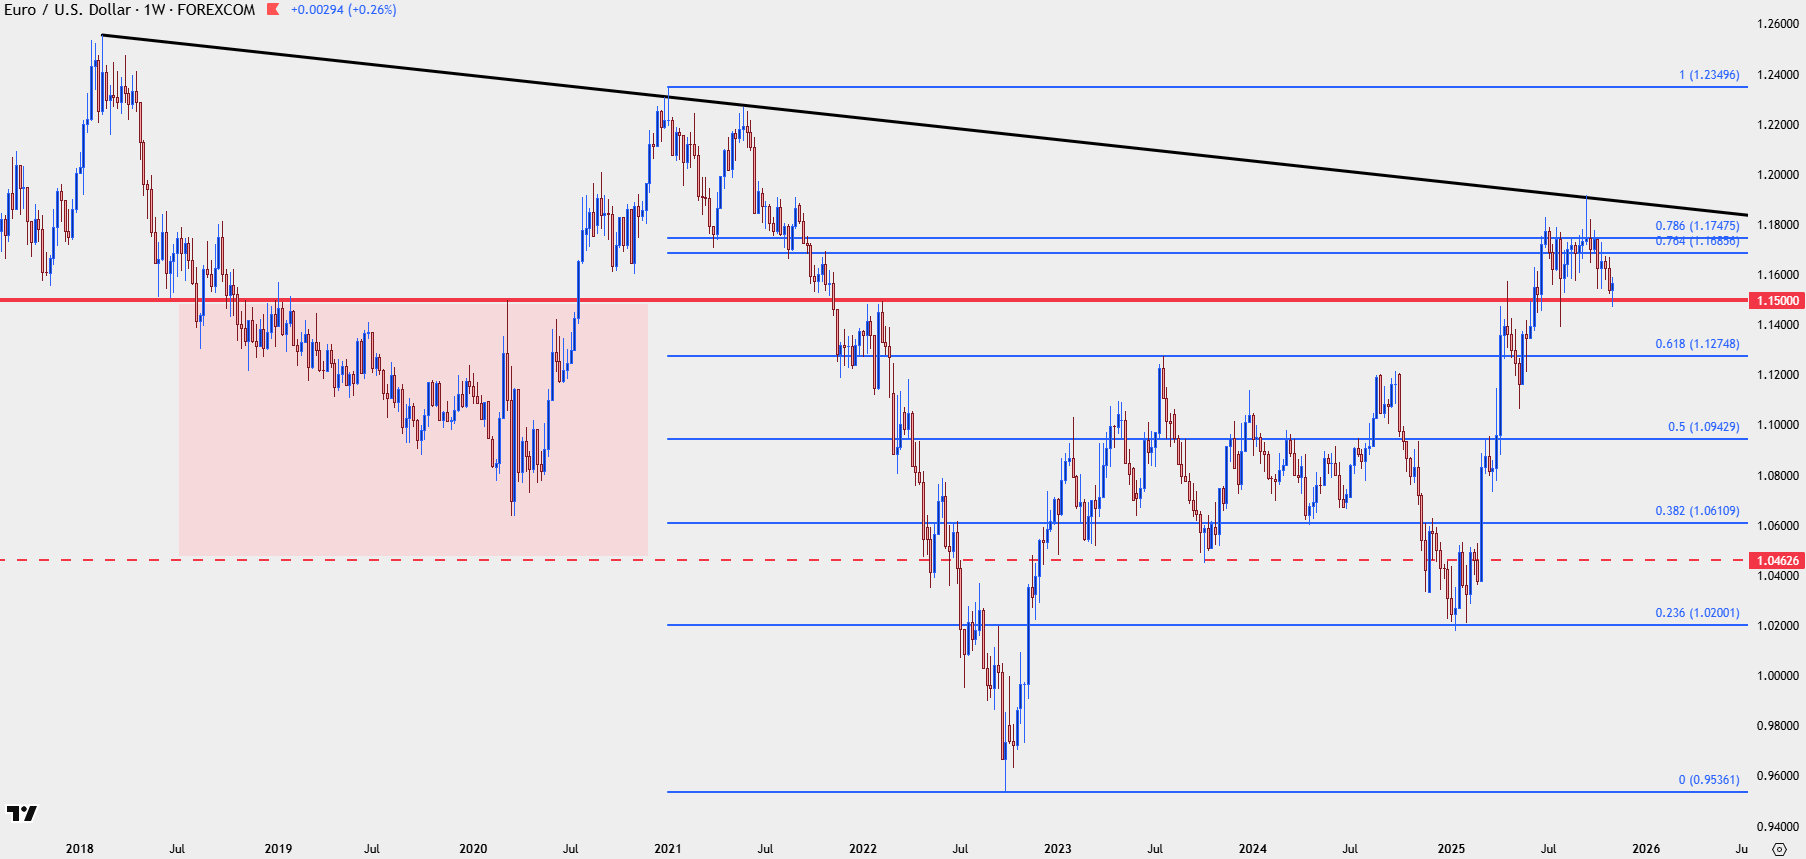
Chart prepared by James Stanley; data derived from Tradingview
EUR/USD Daily
The daily chart further illustrates that recent build of lower-lows and lower-highs that started at the Fed’s rate cut announcement on September 17th. Ahead of that, Christine Lagarde sounded upbeat at the ECB meeting on September 11th, saying that the disinflationary process was over and that the Eurozone economy was in a good spot. This gave the appearance that ECB rate cuts might be over if not nearing an end, but she sounded less upbeat at the bank’s next rate decision that followed the FOMC rate cut on October 29th, that’s what led to the five bar sequence of weakness that lasted through last week’s open.
The bounce from below 1.1500 has already seen a resistance test at the ‘r2’ level looked at in the Tuesday webinar, which is the 38.2% Fibonacci retracement of the May-September major move.
This retains a bearish bias from the daily chart as we go into next week.
EUR/USD Daily Chart
Chart prepared by James Stanley; data derived from Tradingview
--- written by James Stanley, Senior Market Analyst, Global Macro




