


I looked at the level in the Tuesday webinar but the 100.215 spot is extremely important, and that played out this week as it held bulls back despite fresh four-month highs, leading to an evening star formation that finished on Thursday, and continuation of that pullback on Friday. There’s now a test of support at prior resistance as taken from the 99.40 level in DXY and there’s two more spots of support below, at the Fibonacci level of 98.98 and then the swing-low from the FOMC meeting last week at 98.60. In this video, I looked at scenario planning across the USD in EUR/USD, GBP/USD, USD/JPY and USD/CAD.
USD
I’m still looking at the USD as bullish given the continued higher-highs and lows since the start of FOMC rate cuts on September 17th, which follows a similar script as last year. As looked at in the webinar, the monthly chart completed a morning star formation last Friday and that similarly points to strength, and even this week’s pullback makes since if we look at where prices began to stall.
It was the 100.215 level that held the lows last September as the Fed announced their first rate cut and it came in as resistance on August 1st around the NFP report; so it’s a big spot, and it makes sense that longs would look to take profits following a resistance test at that level, combined with a push above the 100-handle.
But the big test for bulls is nearing as we already have a show of support at prior resistance of 99.40, and the 98.98 and 98.60 levels lurk below as ‘s2’ and ‘s3’ supports.
US Dollar Daily Chart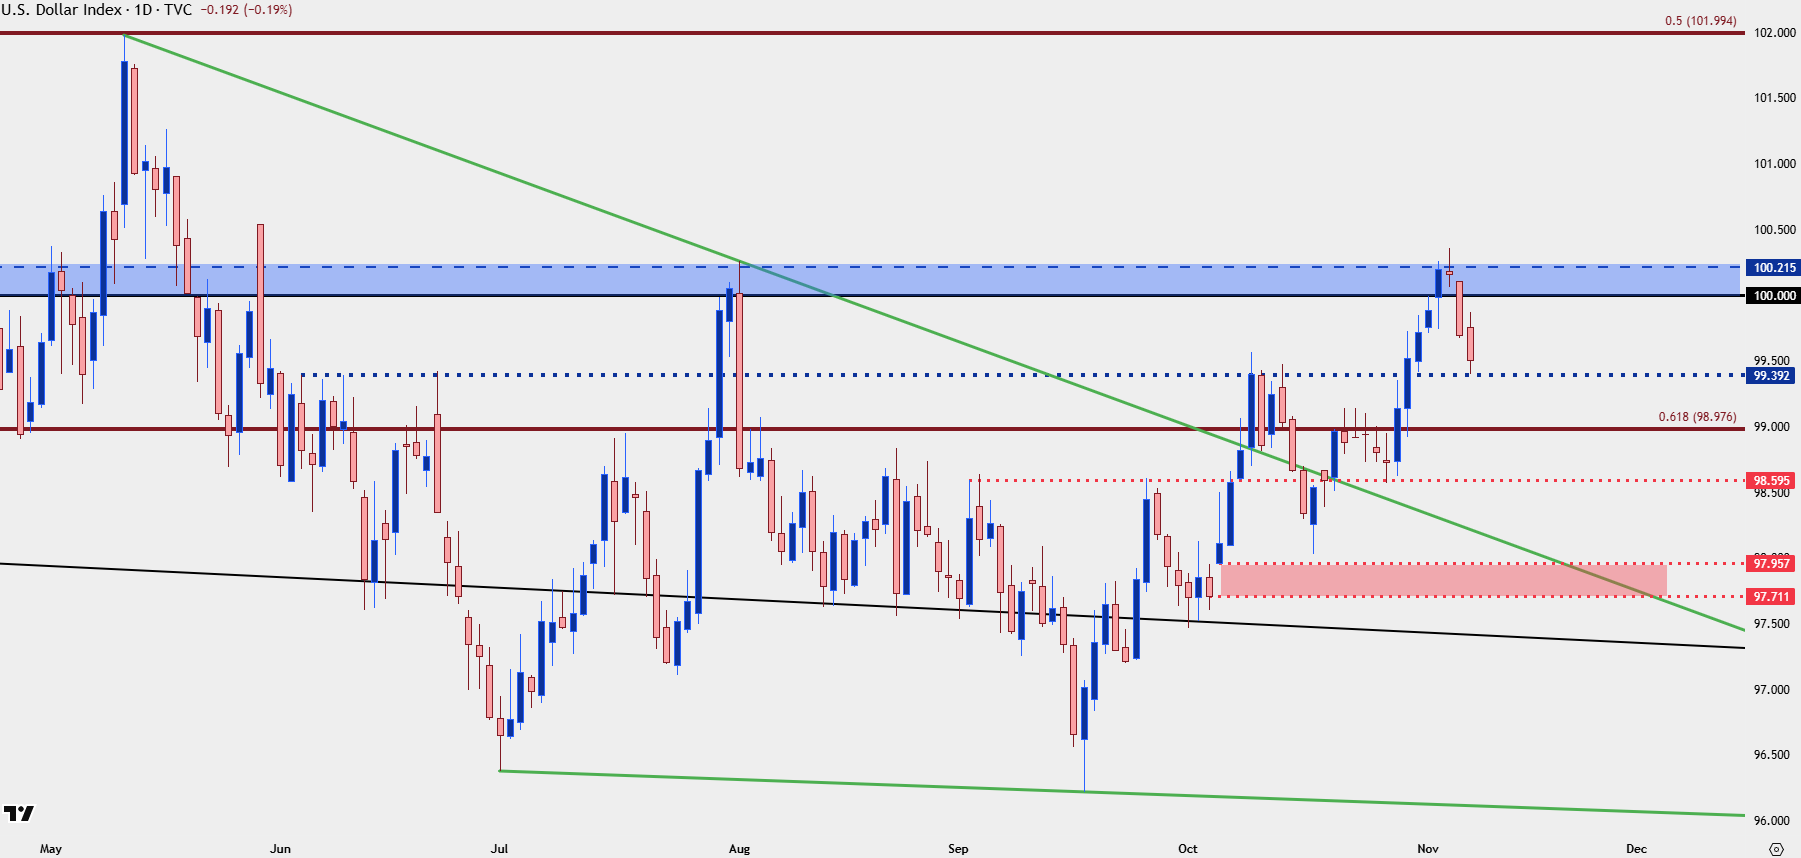
Chart prepared by James Stanley; data derived from Tradingview
EUR/USD
The Euro holds incredible sway here and similarly there’s a big picture theme at-play. The 1.1500 level holds a degree of historical importance in the pair and as I said on Tuesday I’d be surprised if there wasn’t at least some shifting in flows following the first re-test below that price since August.
That shifting has since taken place, and I have EUR/USD at the ‘r2’ resistance of 1.1593, or the 38.2% Fibonacci retracement of the May-September move.

There’s more context for resistance overhead at 1.1686 as that’s the longer-term 76.4% retracement, followed by 1.1748 as the 78.6% retracement of the 2021-2022 major move.
Shorter-term, I’m looking to the neckline of the double bottom formation a few weeks ago as a level that can open the door for short-term strength, and that plots from 1.1631-1.1646.
EUR/USD Daily Chart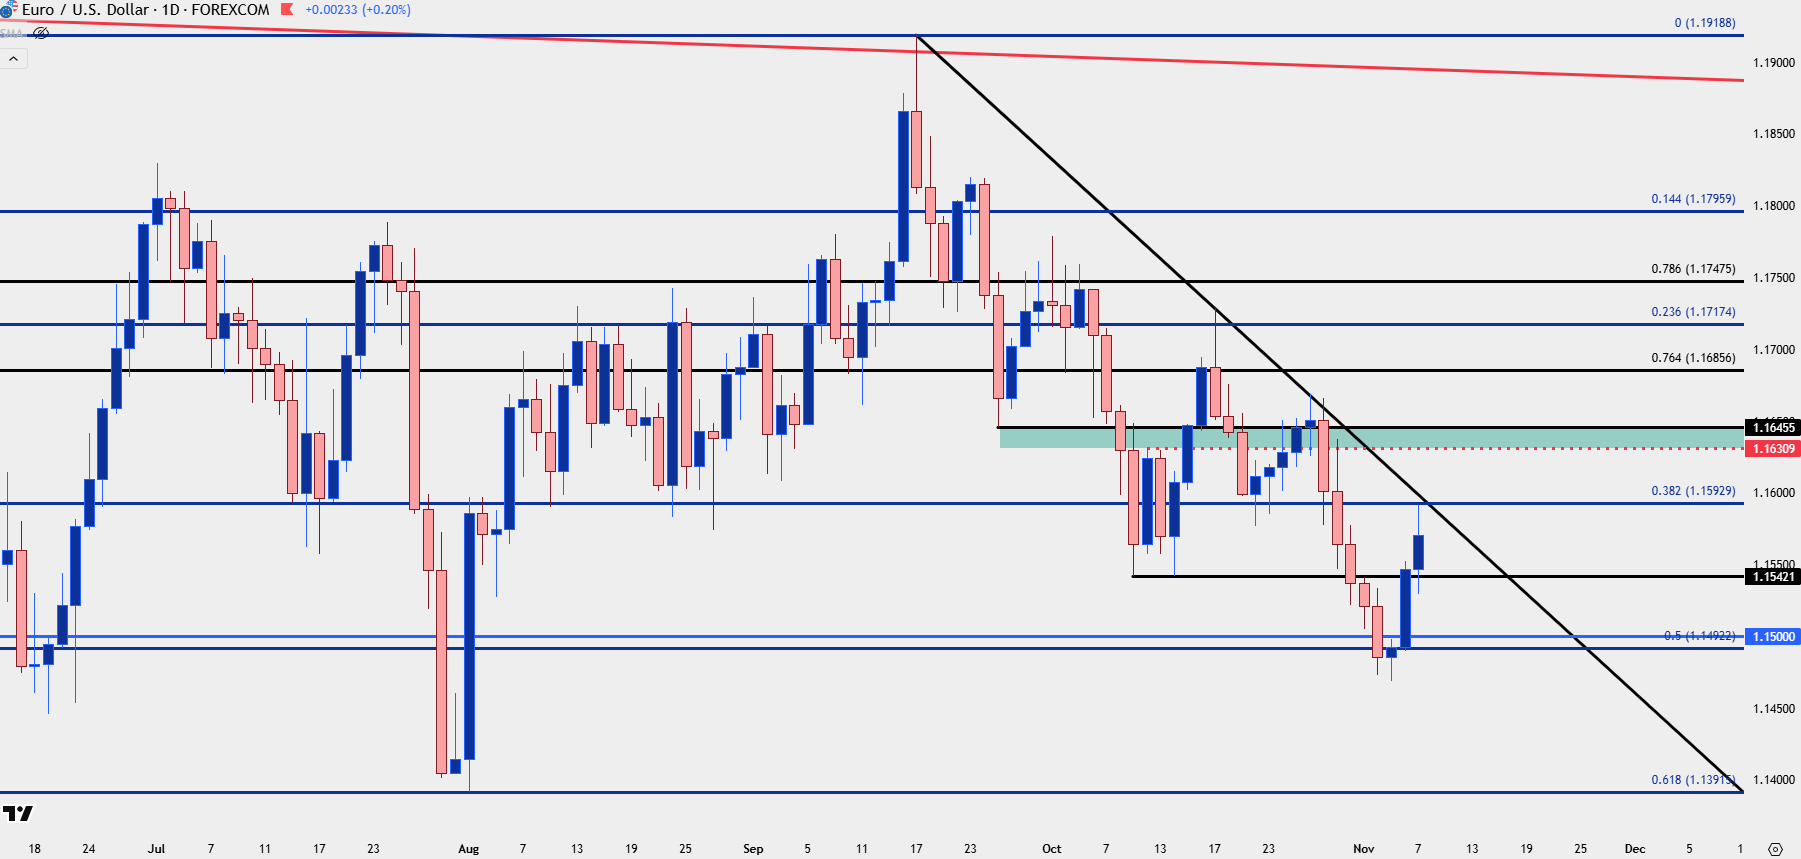
Chart prepared by James Stanley; data derived from Tradingview
GBP/USD
GBP/USD was in a dire place at the Tuesday webinar as RSI on the daily was already below the 25-level, it’s lowest reading since September of 2023. Price was also quite close to the 1.3000 level, and despite Cable having been one of the weaker majors to illustrate that USD-strength at fresh four-month highs, the backdrop for continuation was dim.
A strong pullback developed in the back-half of the week and that deep oversold reading is no longer there. Shorter-term, I think there’s an easier case to justify strength than EUR/USD above; but it’s the 1.3250 level that looms large overhead and a test there could be re-opening the door for bears, particularly if we’re seeing a hold of ‘s2’ or ‘s3’ support in DXY.
GBP/USD Daily Chart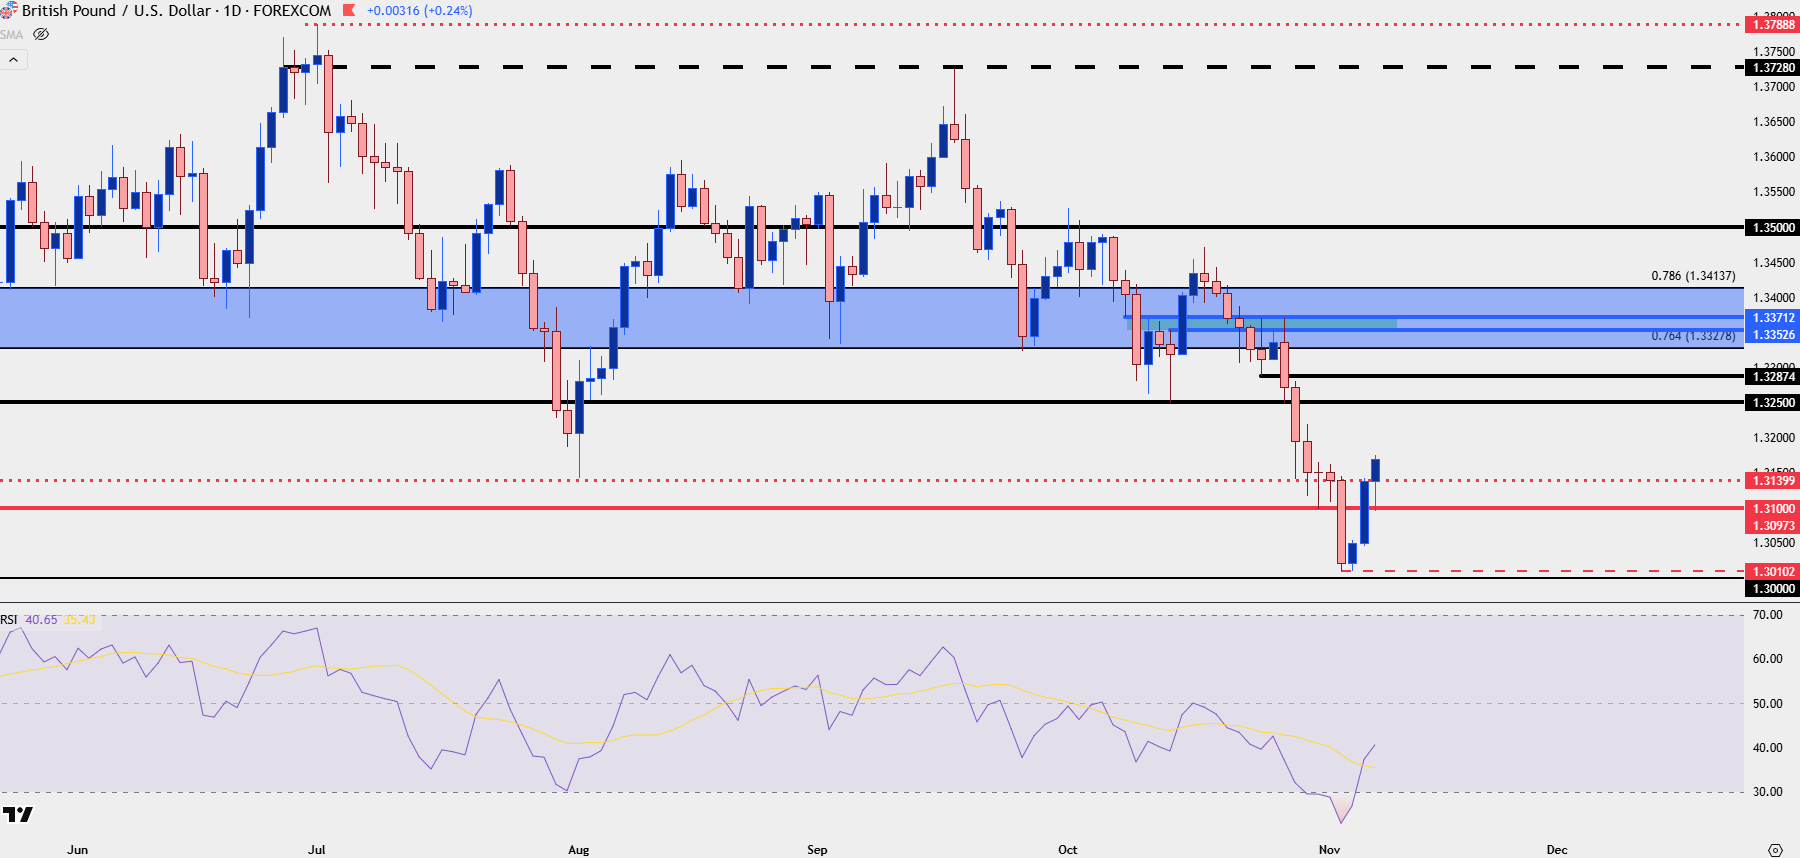
Chart prepared by James Stanley; data derived from Tradingview
USD/JPY
USD/JPY was so strong earlier that intervention fears began to enter the equation. But five consecutive days of stalling at Fibonacci resistance of 154.33 has quieted that fear, and the pair is lining up to remain as one of the more attractive bullish USD backdrops.
Position on the chart is still of a challenge, however, as we’ve dipped below the prior resistance of 153.28 but haven’t quite stretched down to the key zone at 151.95-152.18.
But, so far today we have a matched low, and at the time of the video the daily bar was showing as a doji. If we do see indecision complete on Friday followed by strength on Monday, we can be looking at a morning star formation which points to re-test of the 154.33 resistance, and possibly even a push up to the 155.00 handle.
If that test of 155 happens quickly, do not be surprised if intervention grumblings show again, which is why I would hesitate from chasing the move-higher and, instead, look for a pullback to support ideally at prior res of 154.33.
USD/JPY Daily Chart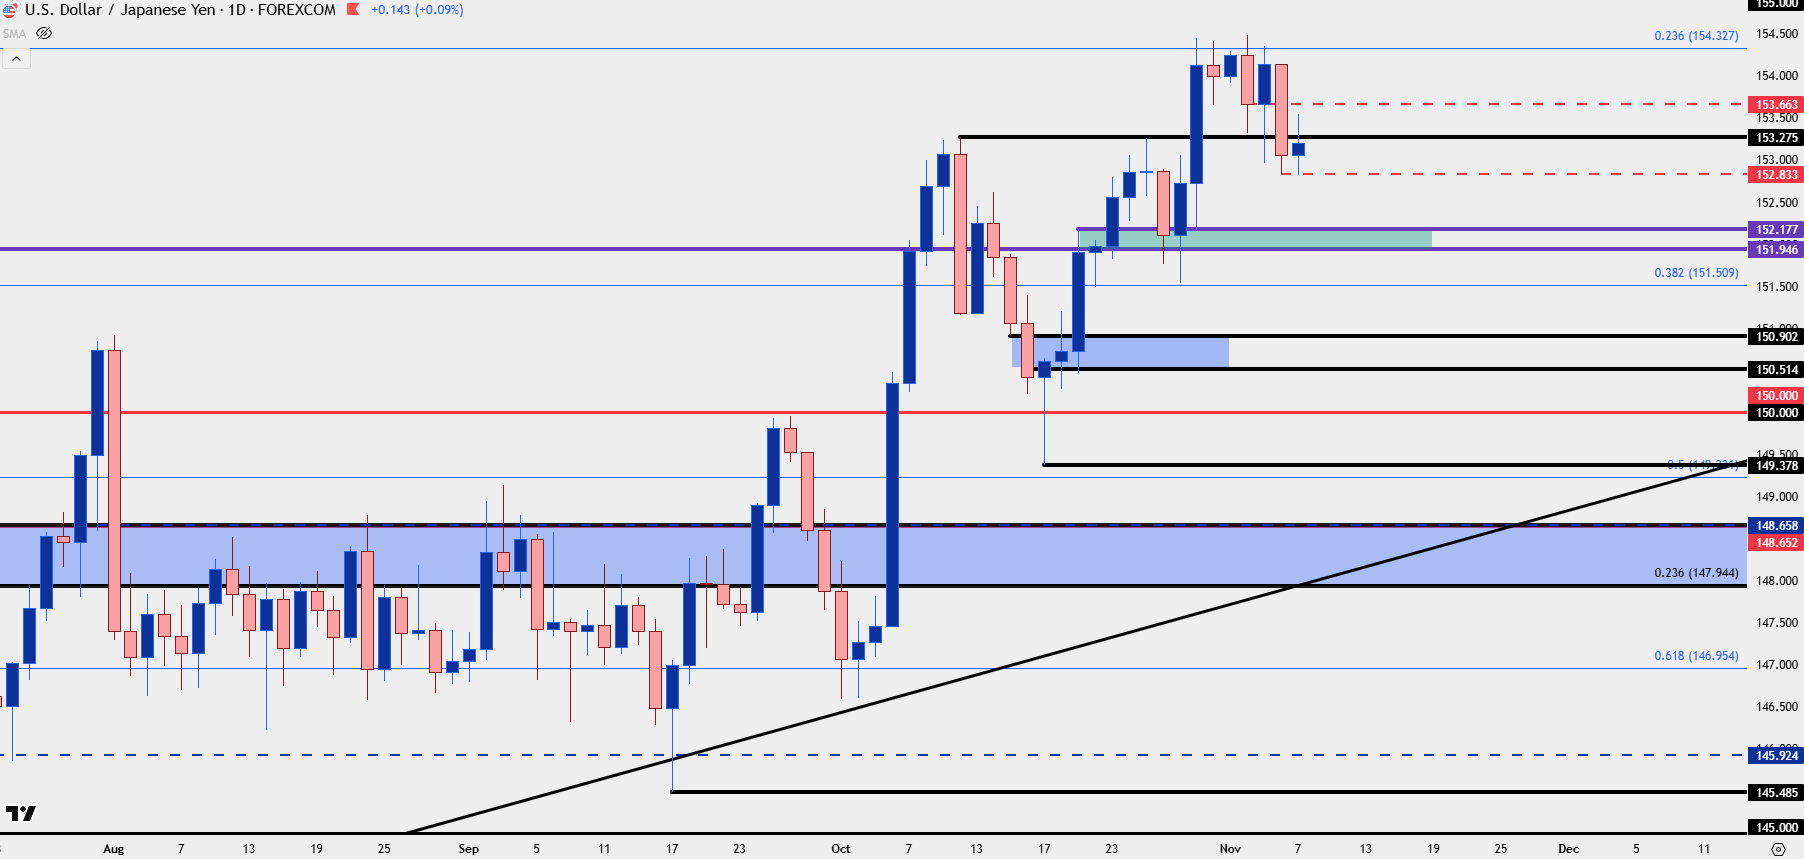
Chart prepared by James Stanley; data derived from Tradingview
USD/CAD
Price came within 10 pips of the 1.4151-1.4178 zone on both Wednesday and Thursday as USD/CAD shrugged off the larger push of USD-weakness. But that caught up on Friday as a strong pullback showed ahead of the weekend.
Initially, there was a pullback to ‘s1’ support at prior resistance, but that sell-off has continued and price is now bearing down on the ‘s2’ level of 1.4034. Perhaps more importantly to the bigger picture is that 1.4000 level, which was sliced through quickly when the breakout was pushing in October and then again when the bullish reaction to the morning star around BoC and FOMC pushed up to another fresh high.
So far, there hasn’t been much for support testing at 1.4000 and that would be peculiar for such a significant psychological level, especially considering how it held resistance back in May. I’m tracking that down to 1.3981 as the ‘s3’ zone for the pair, and this would similarly retain attraction for bullish USD backdrops as we go into next week.
USD/CAD Daily Price Chart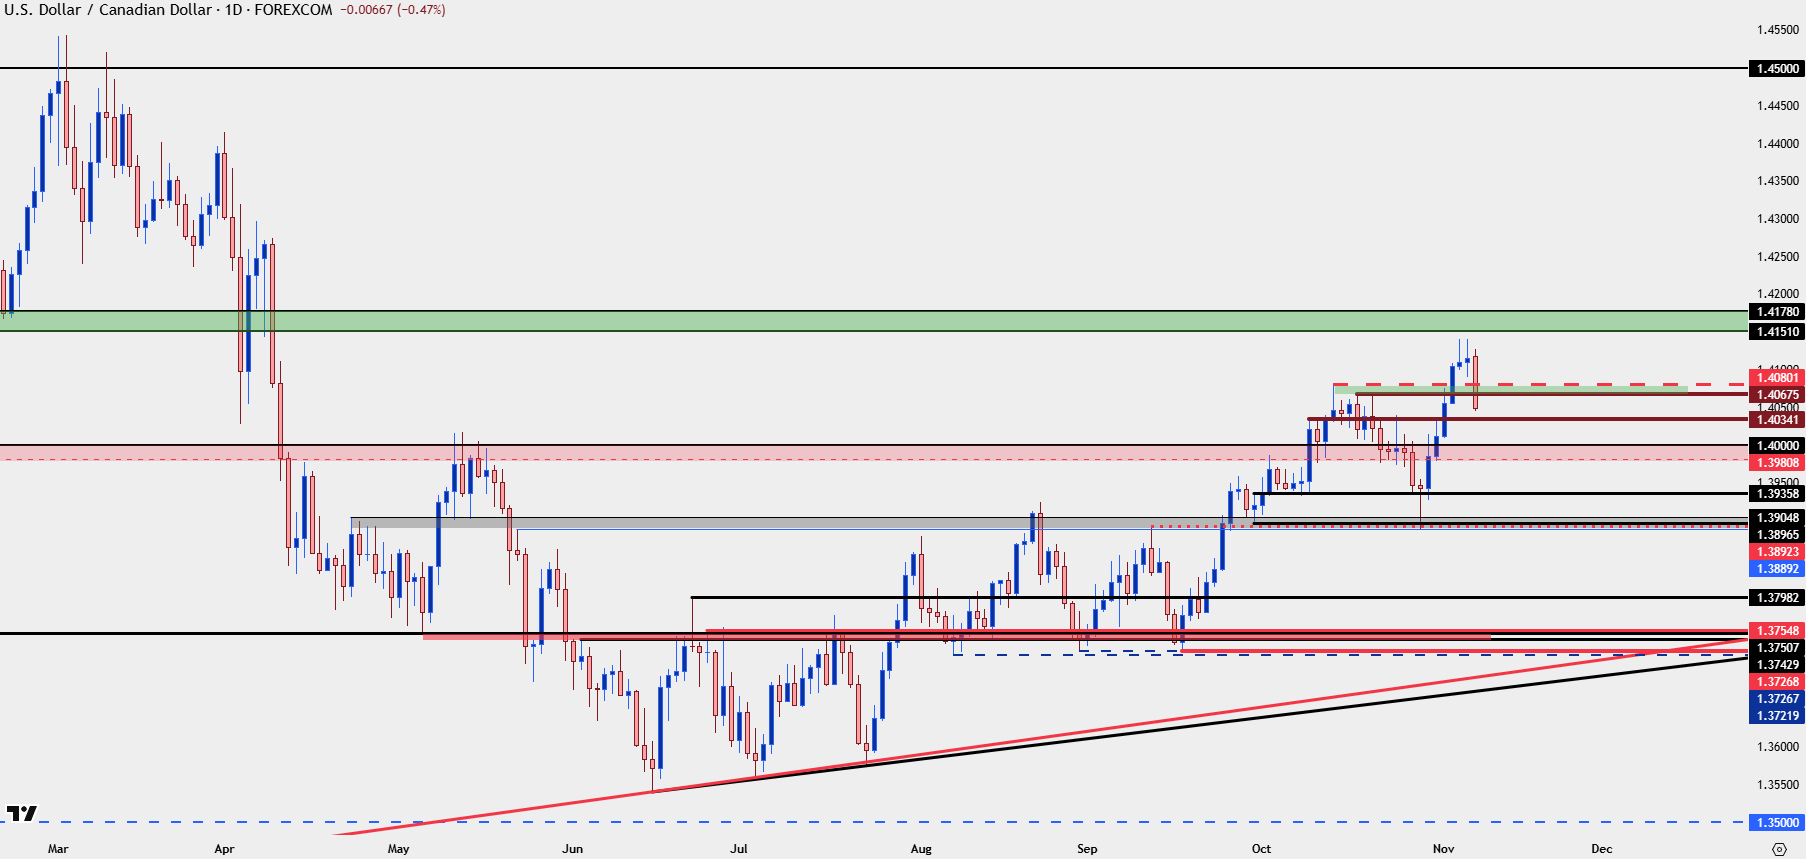
Chart prepared by James Stanley; data derived from Tradingview
--- written by James Stanley, Senior Market Analyst, Global Macro




