
The US Dollar has pushed up to test the resistance zone from 100-100.22 and it’s taken some time for this move to develop. This current resistance test is from the same zone that held the highs back on August 1st, leading to a steep drop following the release of Non-farm Payrolls numbers. But now, we have rate cut rallies taking hold in DXY very similar to what appeared last year when the Fed cut while inflation was already above target.
The big test now is whether EUR/USD can continue to fall following the first re-test of the 1.1500 handle since that August 1st NFP report. That’s a major level in the pair historically speaking, and it could lead to a short-term pullback that highlights a few different spots of resistance in the pair. USD/JPY is already testing a spot of support following a stall at a Fibonacci level, and USD/CAD has pushed up for a fresh high while abiding by the structure that’s been set over the prior few months.
USD
I looked at this in the Friday video but there’s another bullish factor at play now with the completion of the morning star formation on the monthly chart. The September doji, even as the Fed started a rate cut cycle, mirrors the doji that set in January, which led to a decisive swing in the greenback. This time, however, that indecision has been followed by strength after a steep decline in the first-half of the year.
Shorter-term, the breakout from the falling wedge remains clear, with price pushing up to the same zone that held the highs after the Fed’s July rate meeting. That zone goes all the way up to 100.22 (100.215, technically) and that’s the swing-low from last September, when DXY found a bottom right when the Fed began to cut rates.
This is a good illustration of ‘sell the rumor, buy the news,’ and so far this year we’ve seen a similar outlay as DXY has continued to craft higher-highs and lows since the Fed’s rate cut announcement on September 17th.
For structure, there’s now support potential at 99.40, 98.98 and then 98.60, which was the swing low looked at in last week’s webinar.
US Dollar Daily Chart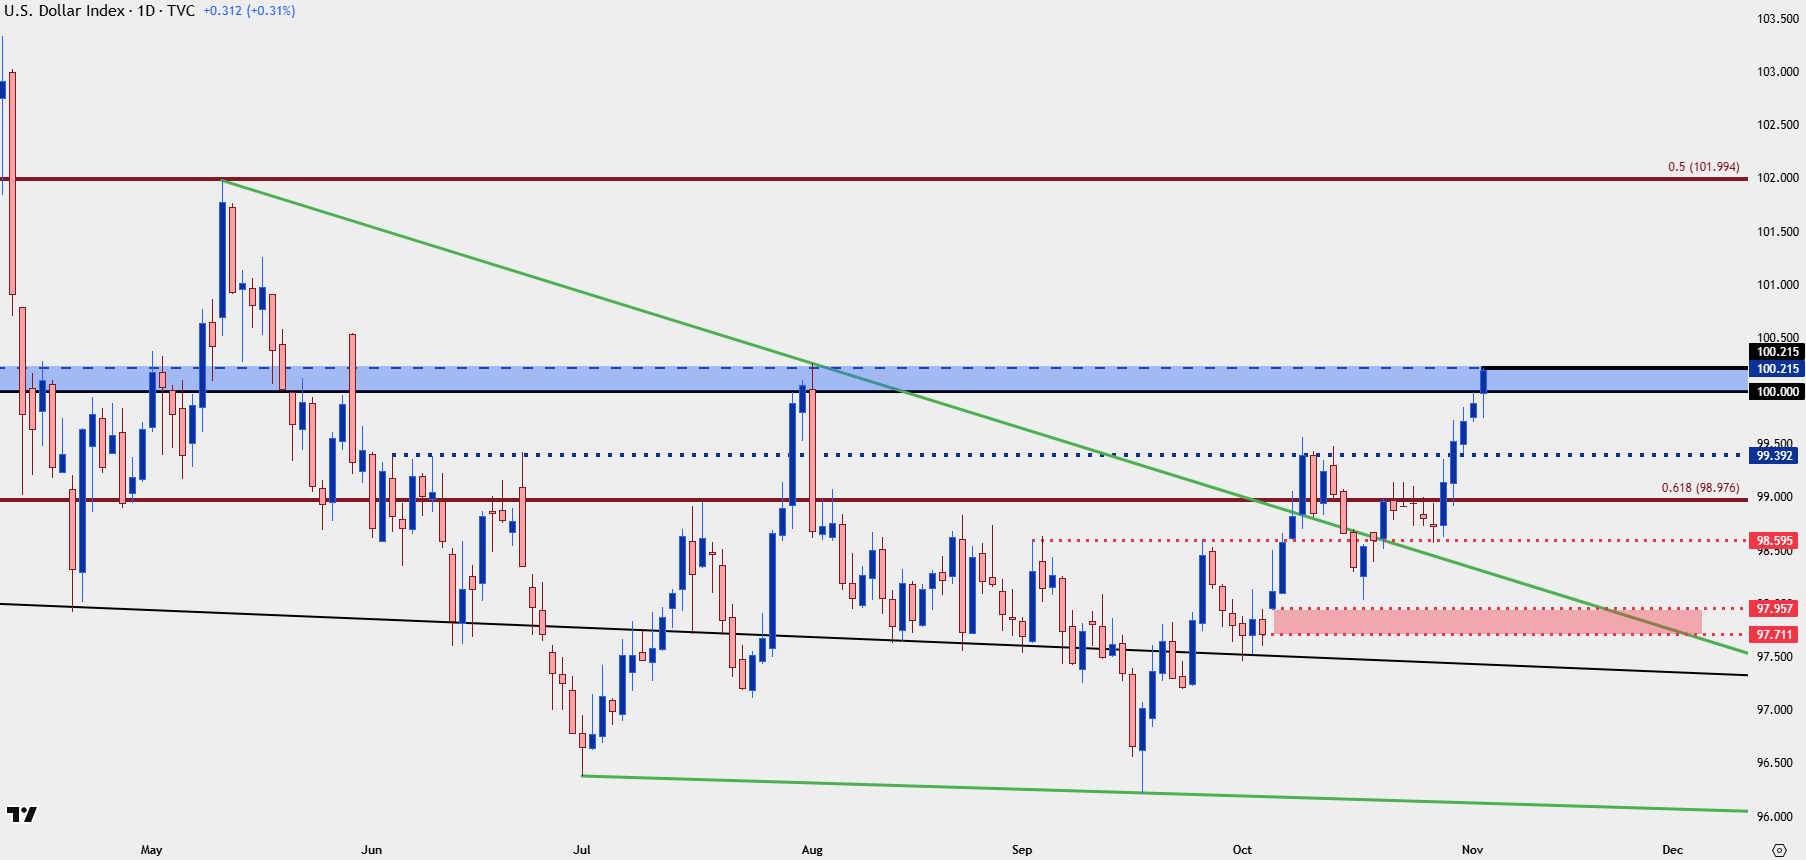
Chart prepared by James Stanley; data derived from Tradingview
EUR/USD
The 1.1500 level has historical importance in EUR/USD as it served as resistance for a couple of years in 2014-2015 as the pair ranged for an extended period of time. And then it became the swing-high in March of 2020 as Covid was getting priced-in. More recently, it induced a four-week pullback in the pair in April and then it helped to prod support in early-August, right around that NFP report rally. D

Sellers have already pushed through the level but the challenge now is the prospect of chasing following the first re-test of the big figure in three months. This highlights resistance potential, at which point sellers can show their hands at 1.1543, 1.1593 or 1.1631-1.1646.
EUR/USD Daily Chart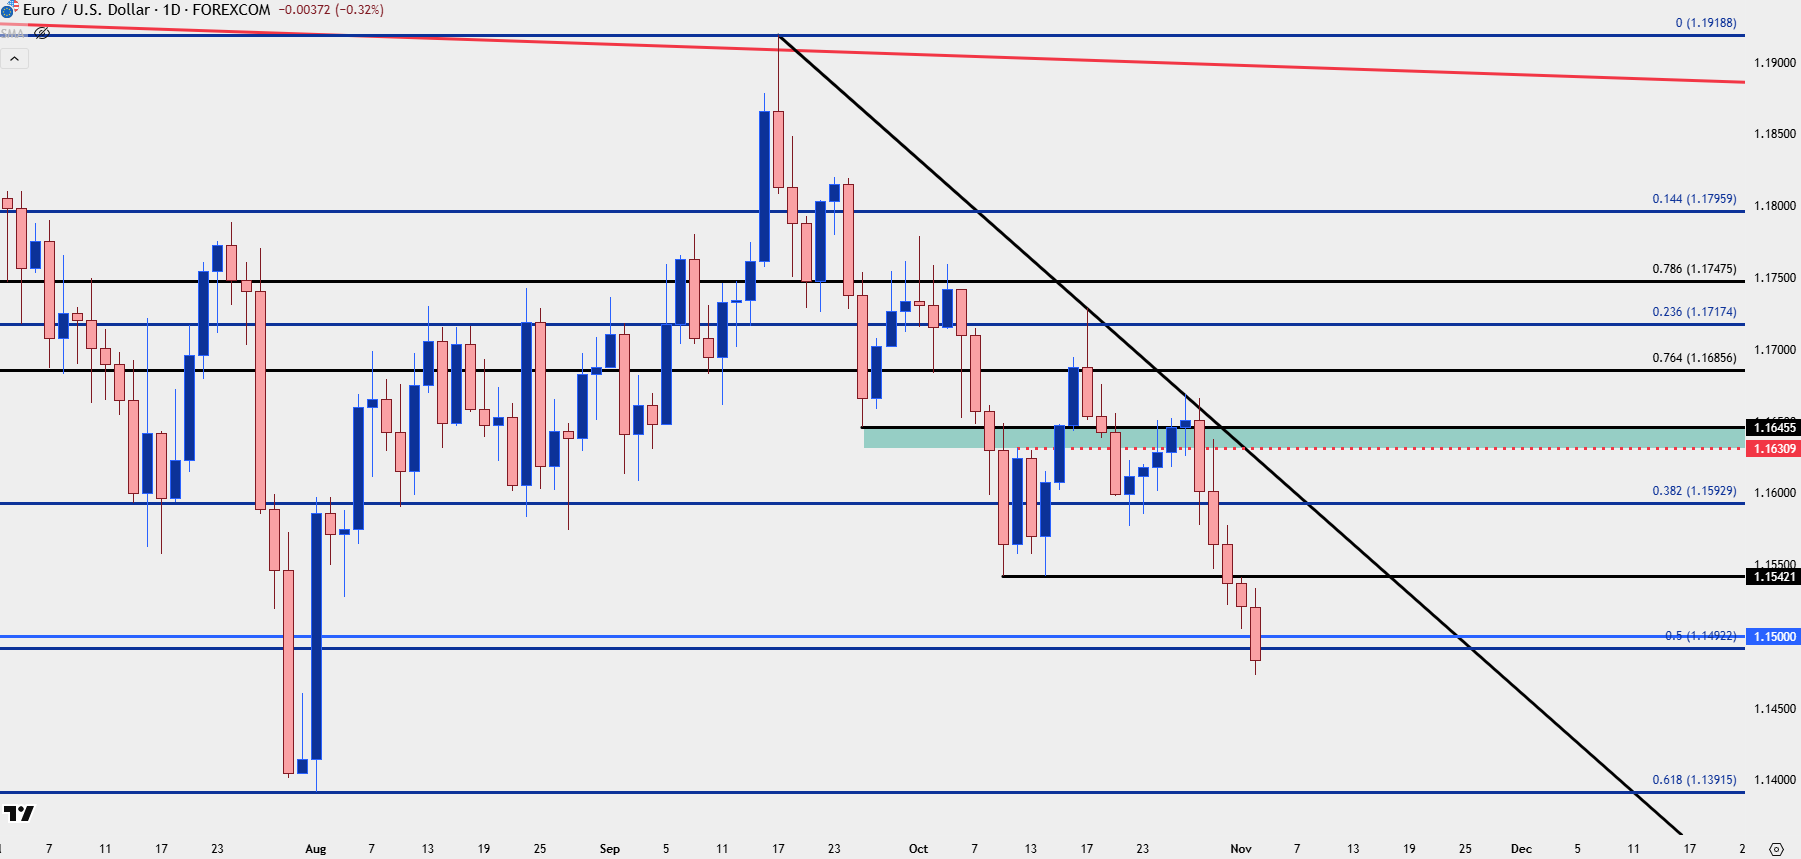
Chart prepared by James Stanley; data derived from Tradingview
GBP/USD
Cable has been beaten up pretty heavily and it’s even more difficult to chase than the above in EUR/USD. The pair is fast approaching the 1.3000 level which is similarly an important psychological level for the pair, historically speaking. But in GBP/USD, there’s also the oversold reading on the daily chart with RSI currently showing below 23.00, which is the lowest such reading since October of 2023 on Daily GBP/USD.
While the trend is decisive, a test of 1.3000 followed by evidence of a short-term bounce can be looked at for possible pullback setups, essentially looking at short-term reversal backdrops.
GBP/USD Daily Price Chart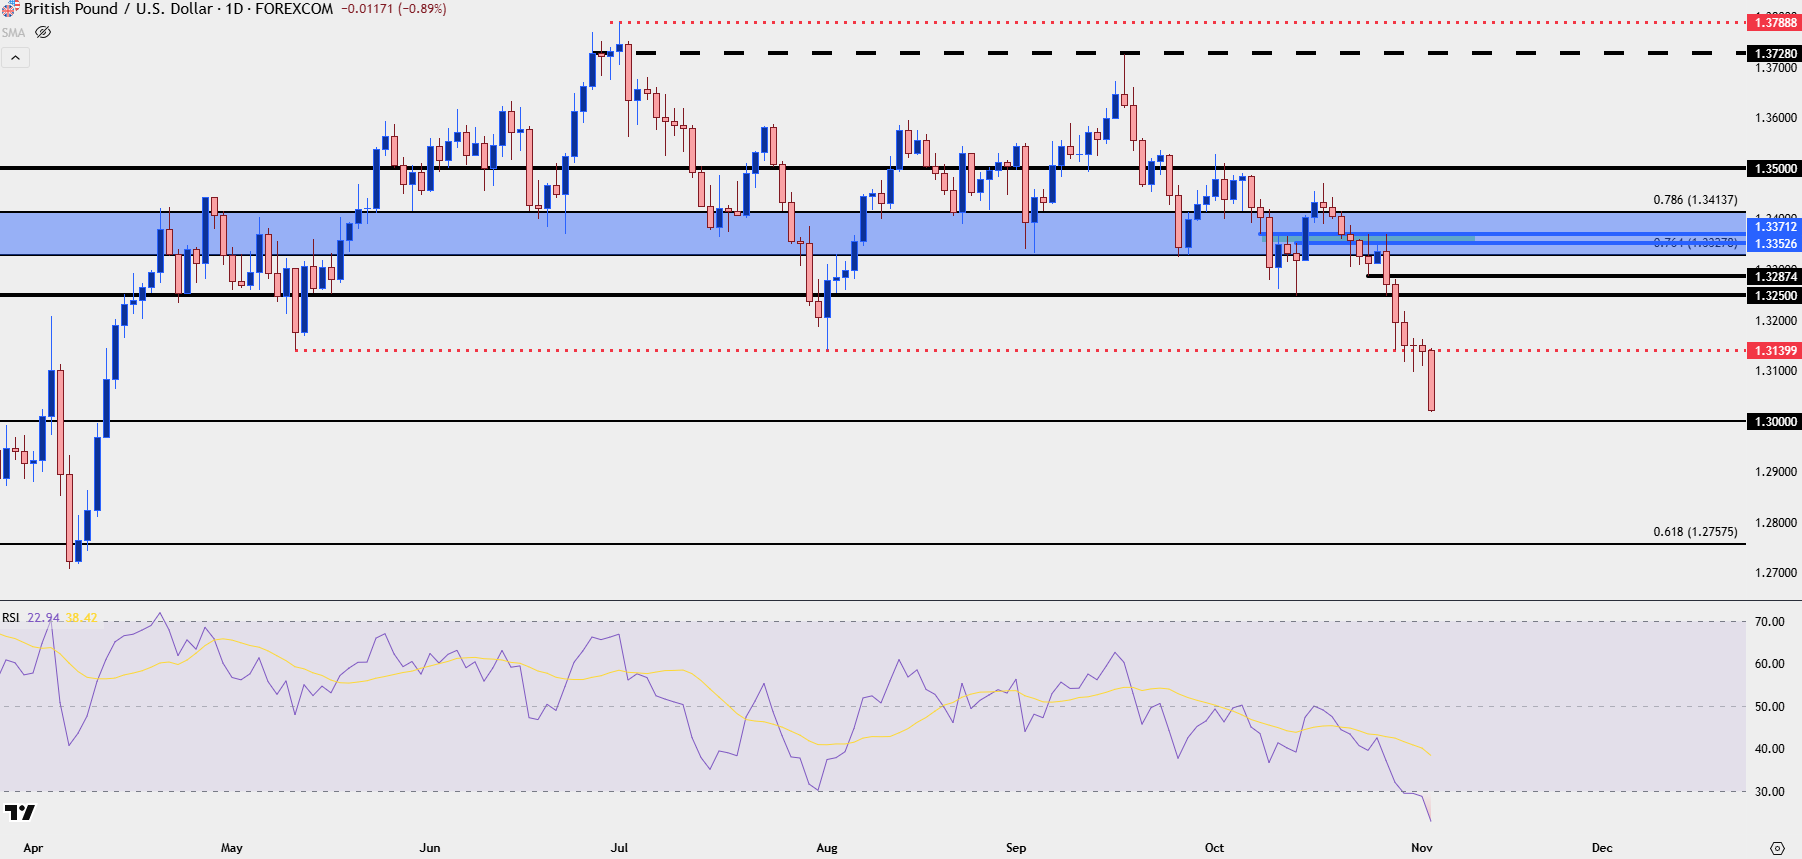
Chart prepared by James Stanley; data derived from Tradingview
USD/JPY
USD/JPY was very much a part of the USD-strength drive in early-October but over the past few days, the pairs been noticeably more quiet with resistance holding at 154.23. The 155.00 level sitting overhead is an obviously big spot, as it is the kind of price that can get the attention of the Japanese Ministry of Finance, but as we’ve seen from prior episodes, it often takes time before they order an intervention.
Interestingly it was the 151.95 level that saw the pair top out in 2022 and 2023, which then became support last year following another failed intervention that eventually drove the pair to over 160.00. That price is now a key support and if we do see the pullback in USD/JPY continue, that’s the next significant spot of support.
For now, we’re seeing a support test at the same resistance looked at in last week’s webinar of 153.28 and the door remains open for bullish continuation in the pair.
USD/JPY Daily Price Chart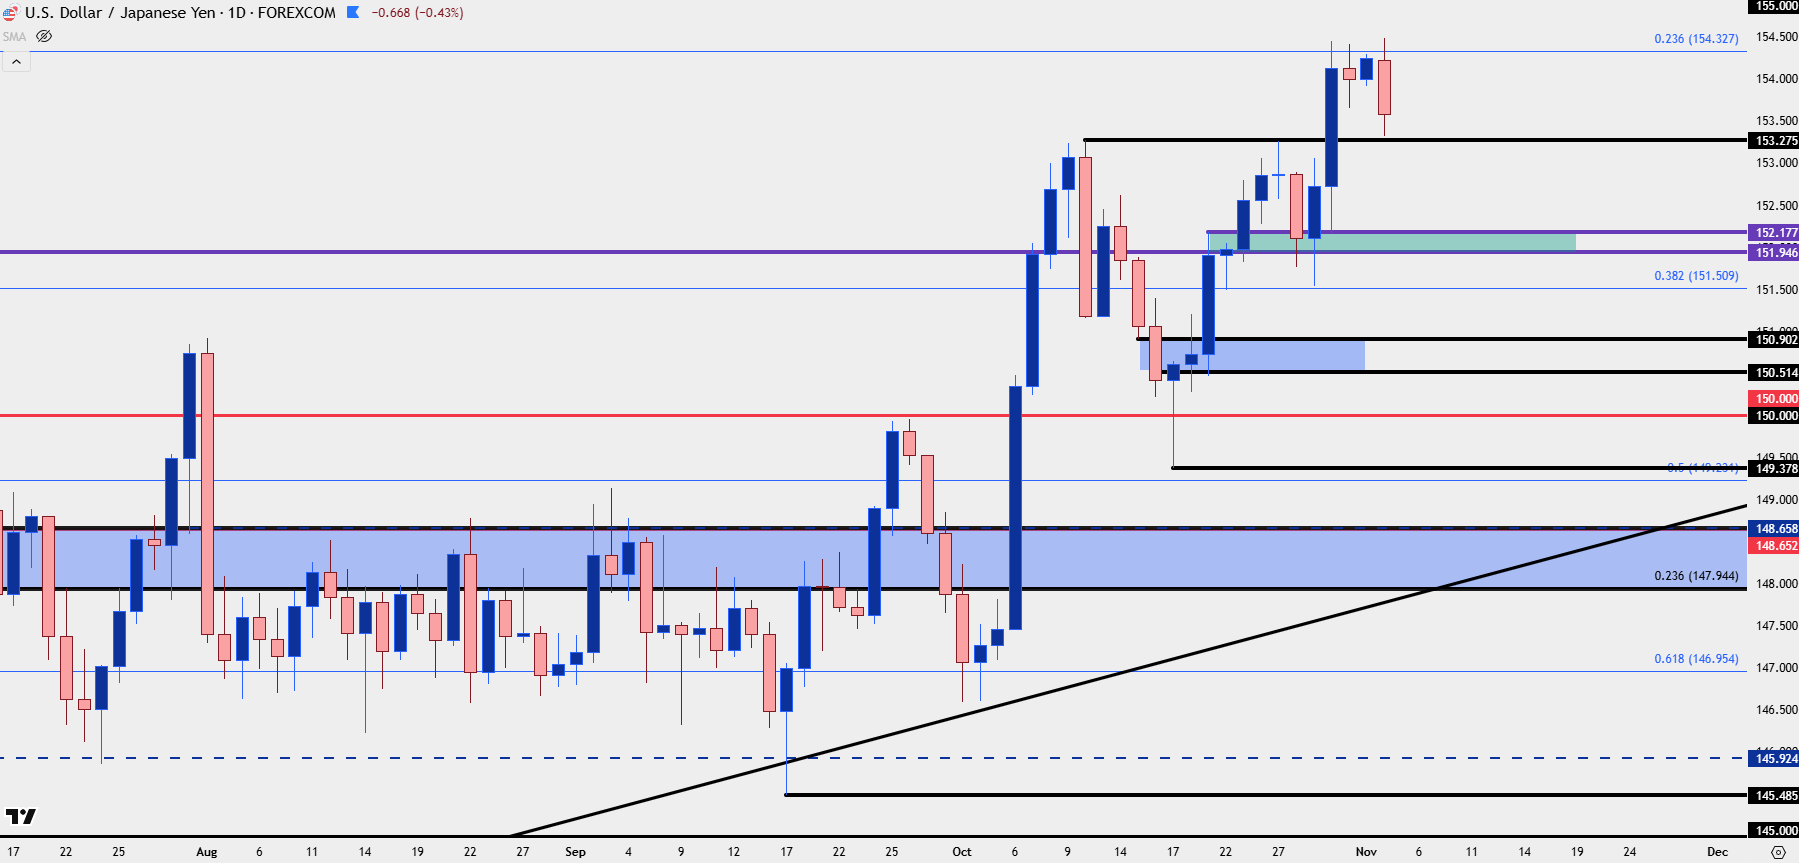
Chart prepared by James Stanley; data derived from Tradingview
USD/CAD
USD/CAD was one of the brighter spots for USD-bulls in Q3 and early-Q4 trade but that trend began to dim after the pair vaulted above the 1.4000 level. A rising wedge formation led to breakdown and as we went into a big Wednesday last week, with expected rate cuts from both the Bank of Canada and the Fed, there was an open door for a deeper reversal.
It was the 1.3900 level that came in as big that morning, leading to a strong pullback with a v-shaped reversal. That saw prices push back above 1.4000 and at this stage there’s a fresh six-month high in the pair as buyers have continued the rally.
The challenge at this point is like GBP/USD, where there’s a clear trend favoring USD-strength but it’s difficult to chase. I would be less inclined to look for reversals here, however, and instead, would be looking for pullbacks to either 1.4061, 1.4034 and then 1.4000.
USD/CAD Four-Hour Chart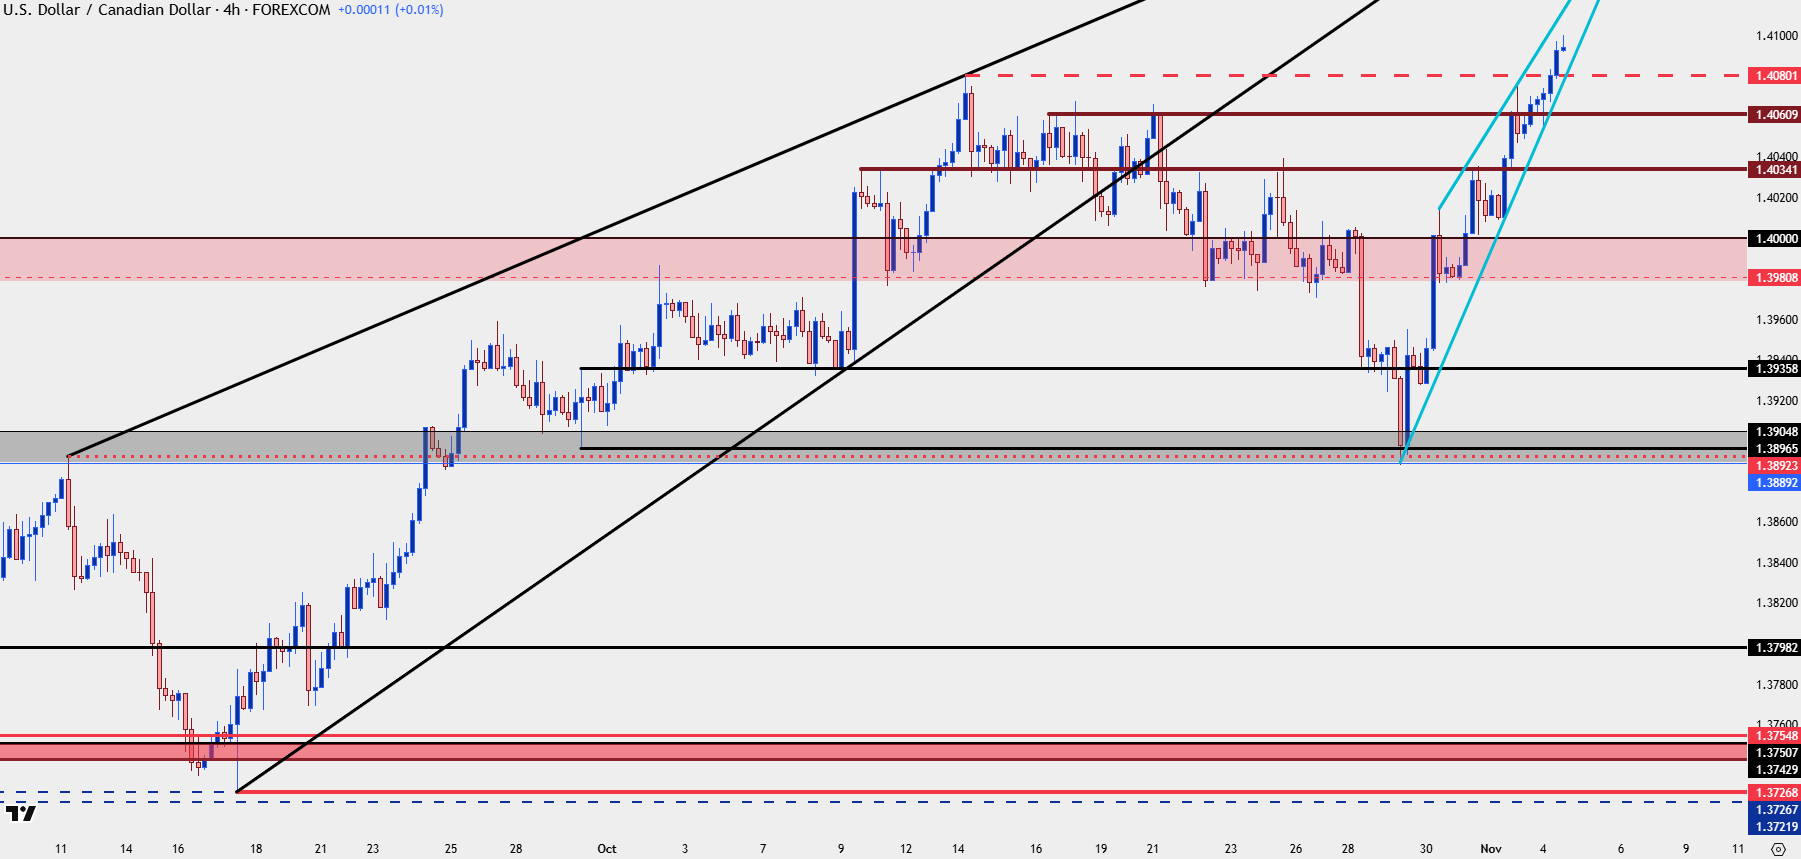
Chart prepared by James Stanley; data derived from Tradingview
--- written by James Stanley, Senior Strategist