

USD, US Dollar Talking Points:
- It’s been higher-highs and higher-lows for the USD ever since the Fed’s rate cut a few weeks ago.
- DXY is now testing a key Fibonacci level at 98.98, while also testing the resistance side of a falling wedge formation. Falling wedges are often approached with aim of bullish reversal and this would stand in stark contrast to the aggressive bearish trend that had shown in the USD in the first four months of this year.
- I’ve been tracking this theme closely in webinars and you’re welcome to join the next. Click here to register.
It’s been a bearish year for the US Dollar especially the first half, which was the largest half-year sell-off in DXY in more than 33 years.
But, since a low was set back in April, USD bears haven’t been able to stretch very far. There’s been a near-constant stall upon tests of fresh low and as of today, DXY is trading above that swing low that was established back in April.
The trepidation from sellers to stretch to fresh lows along with the continued aggression on pullbacks or at highs has allowed for the build of a falling wedge formation, which is often approached with aim of bullish reversal.
And that’s what’s on the table right now…
USD has rallied ever since the Fed started to cut rates three weeks ago and that resembles last year’s move, as DXY sold off through Q3 and into the Fed’s first cut, only to reverse in Q4 and rally into the end of the year. That backdrop also showed as a falling wedge formation, albeit a shorter-term version, as the formation essentially highlights waning bearishness as first noticed by a lack of aggression from sellers at support that can, eventually, lead a larger pullback and then reversal.
US Dollar Daily Chart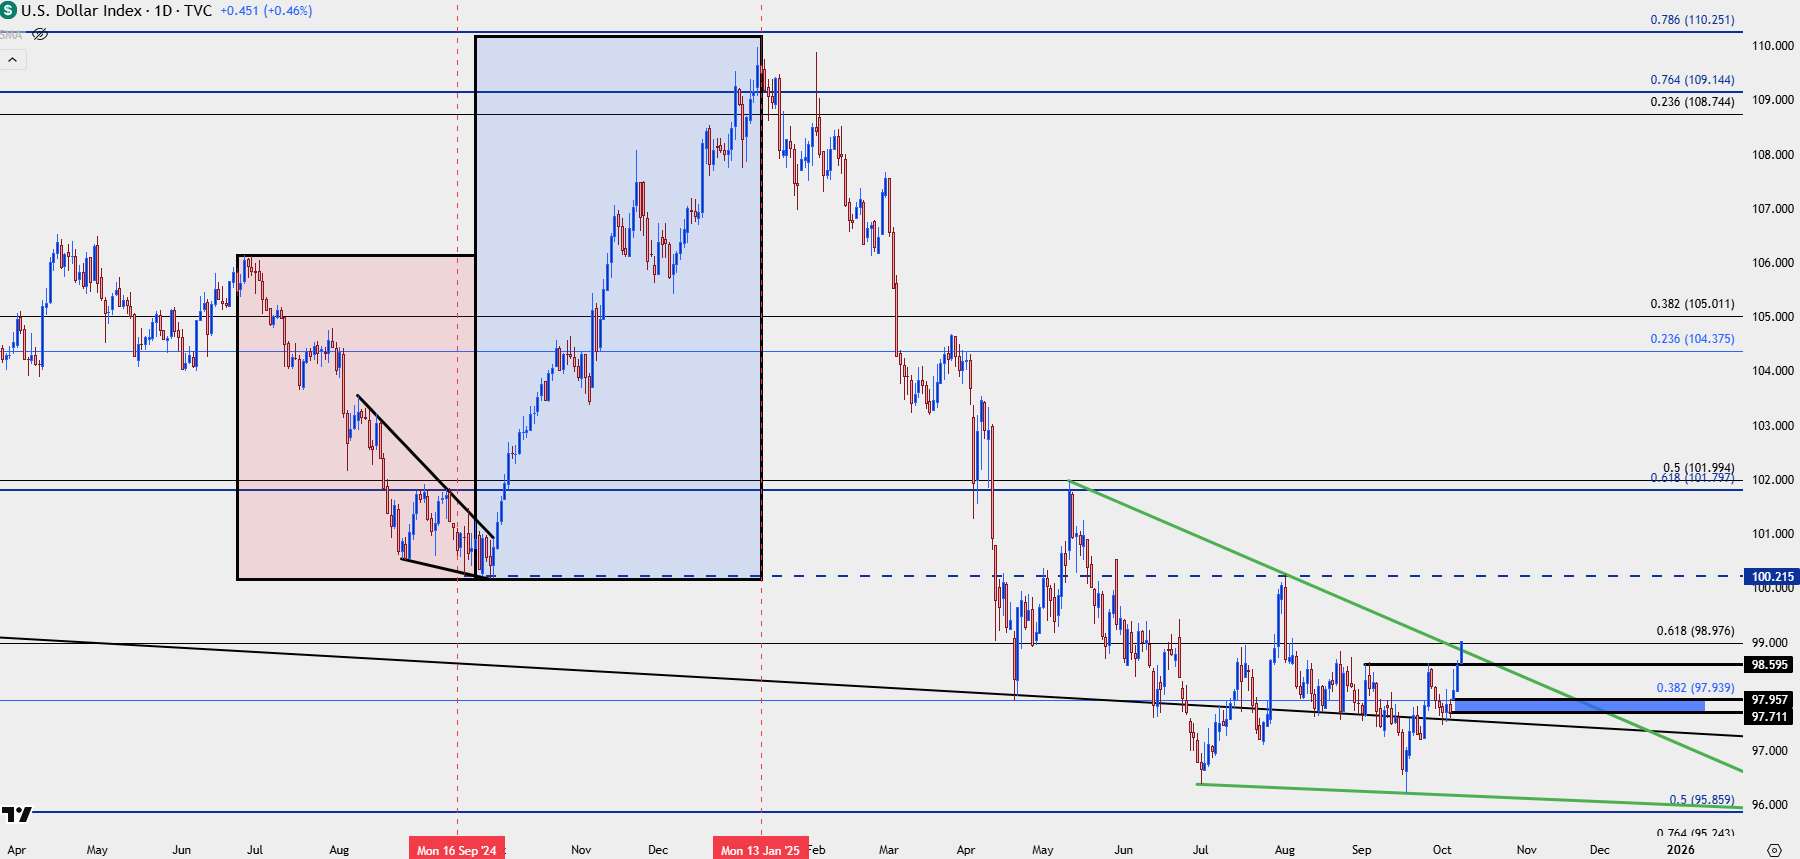
Chart prepared by James Stanley; data derived from Tradingview
USD Bigger Picture
I think the weekly chart around USD illustrates the current backdrop quite well, as it’s been that stalled move over the past few months that highlights how beleaguered sellers had become. This is what allowed for the build of the wedge and now, the possible reversal.
This also highlights a couple of key levels sitting overhead – levels at which there are likely stop order sitting above. The 100.22 level that was the high in August was also the low from last Q3 – a very clean illustration of prior support becoming fresh resistance.
And then at the 102 handle we have the 50% mark of the same Fibonacci retracement that’s produced the 98.98 level at the 61.8% retracement, that’s the level that’s being tested right now.
US Dollar Weekly Chart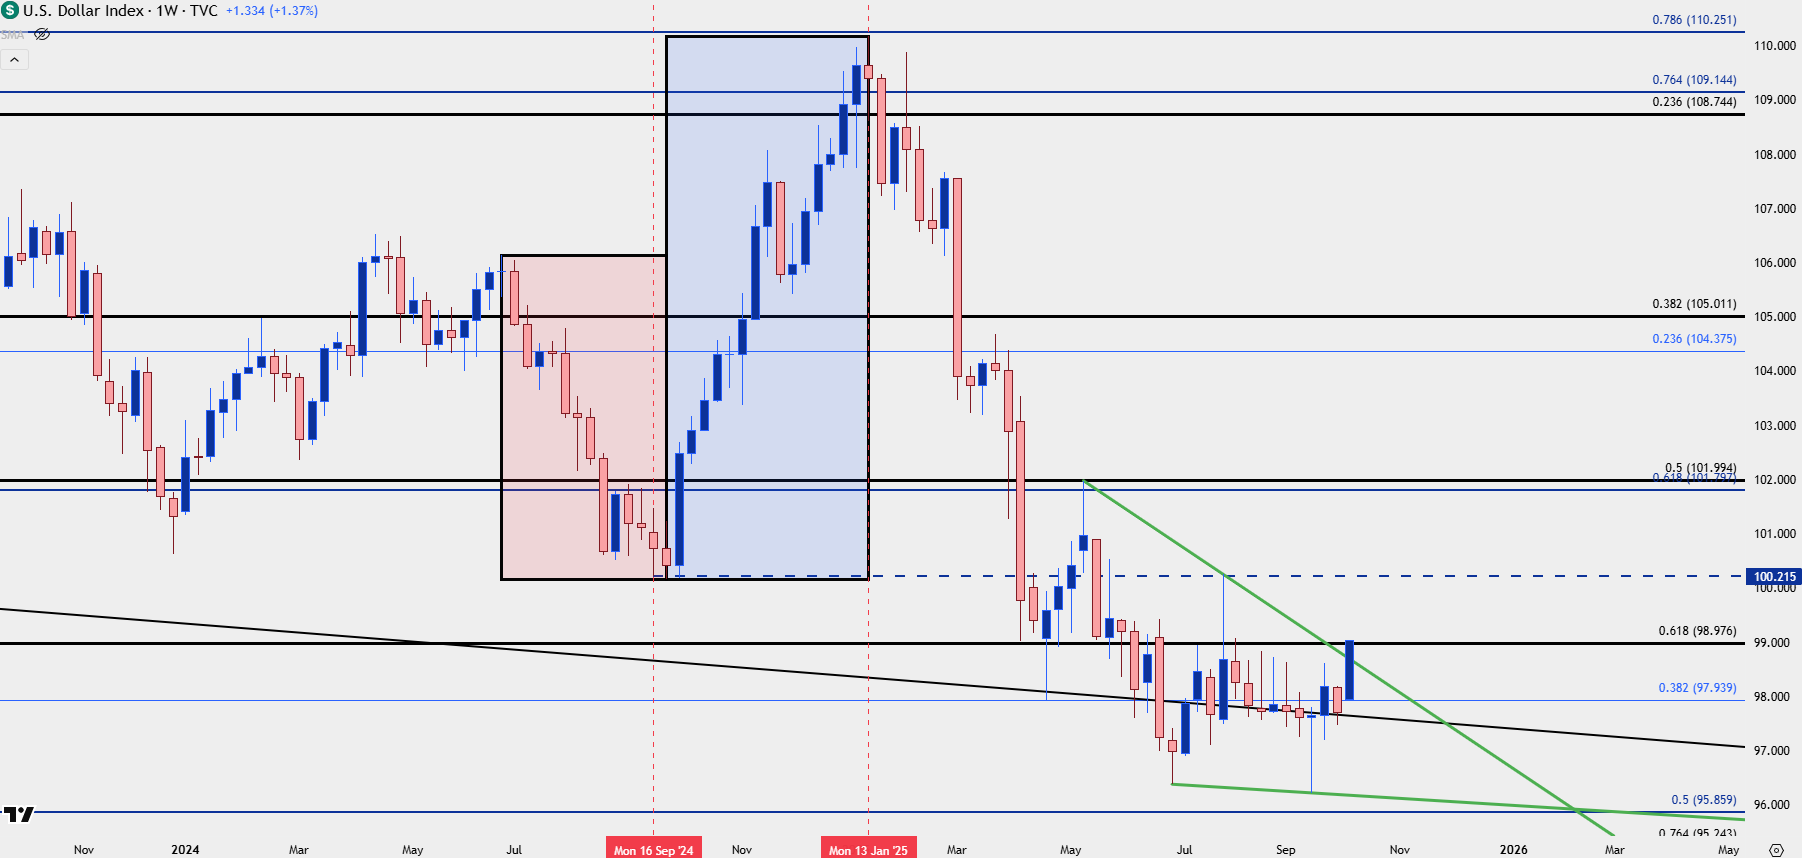
Chart prepared by James Stanley; data derived from Tradingview
USD: How to Work with Long-Term Breakouts
I covered this in the video but at this point there’s a couple different spots of resistance being tested in DXY. That can make for a complicated backdrop as traders are faced with the decision as to whether they should chase the move or not.
On a shorter-term basis, however, there’s a couple spots of support that remain of interest.
This week began with a gap and that gap remains unfilled, running from 97.71 up to 97.96. If prices do pullback, a hold there could be qualified as a higher-low on the daily, thereby keeping the door open for topside continuation.
But ideally, bullish anticipation would disallow that scenario, and an ideal spot in that case would be prior resistance around 98.50-98.60. A show of support there can be justified as a higher-low.
US Dollar Four-Hour Chart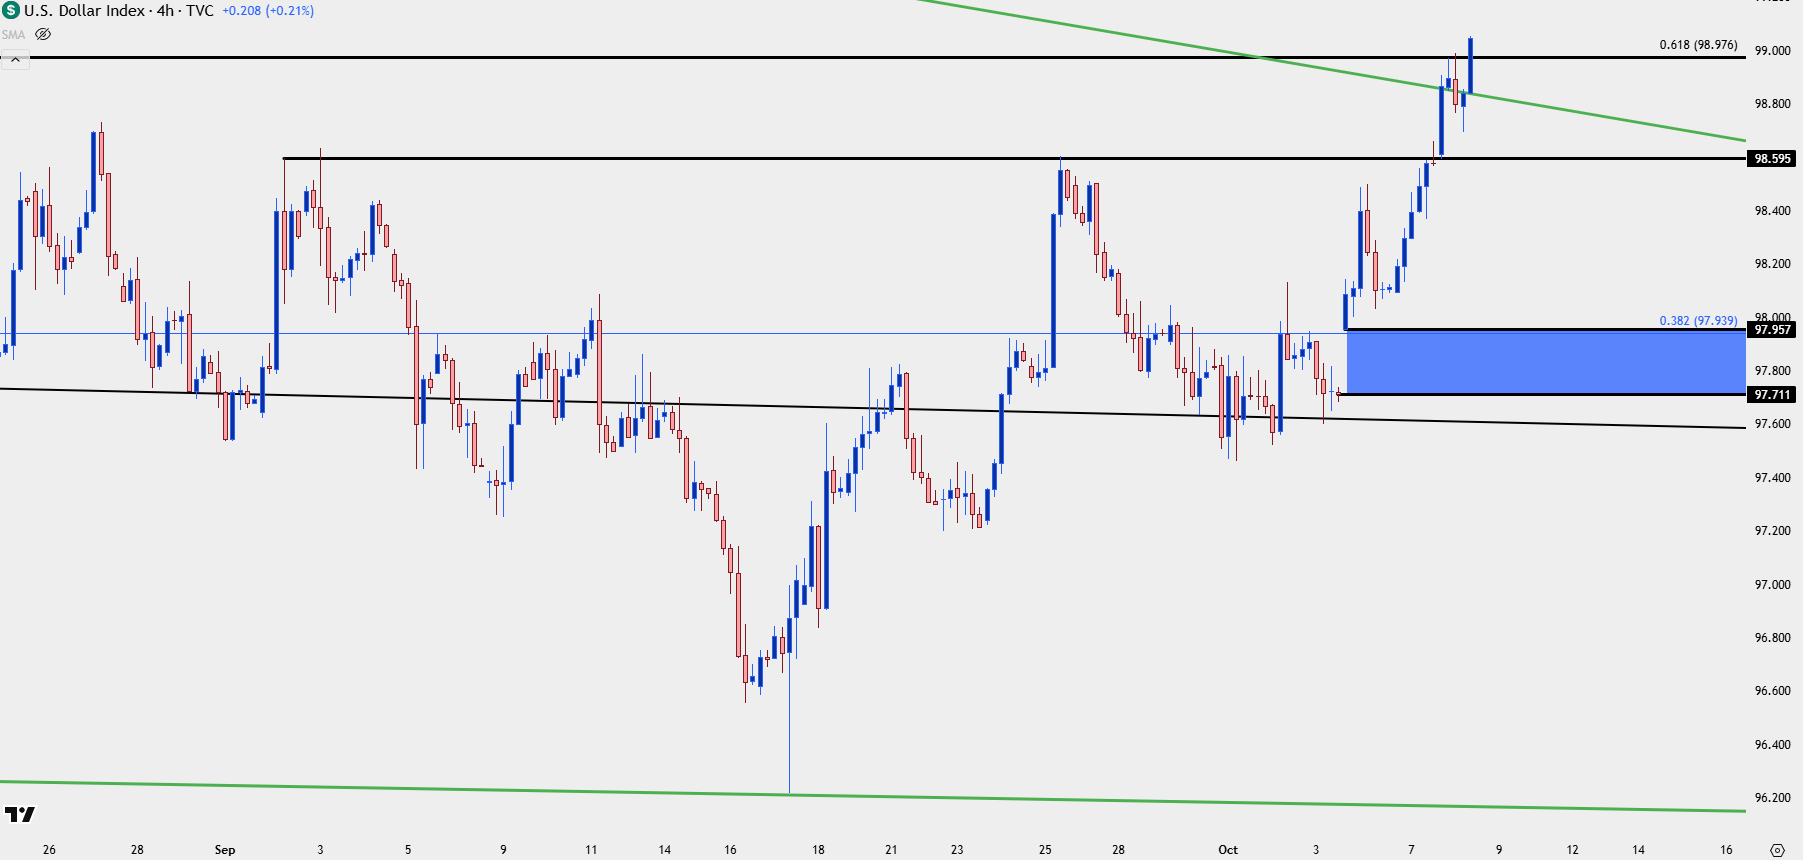
Chart prepared by James Stanley; data derived from Tradingview
--- written by James Stanley, Senior Strategist




