


US Dollar Talking Points:
- The US Dollar has remained stalled on longer-term charts and shorter-term, there’s a remaining series of higher-highs and lows since the Fed’s rate cut announcement two weeks ago.
- With the US government shutdown markets will be missing a key aspect of US data, and this puts attention to lower-tier data items, like ADP, or more subjective items like speeches from Christine Lagarde and Jerome Powell for next week.
- I’ll be looking at each of these pairs in the weekly webinar and you’re welcome to join the next. Click here to register.
Last year saw a stunning USD rally develop in Q4 even as the Fed cut rates. Before that, there was a falling wedge formation that had built, indicating that the upcoming rate cut was already well priced-in ahead of time.
Falling wedges are often tracked with aim of bullish reversals, and from the weekly USD chart, there’s another falling wedge formation that’s built over the past few months. And given that the prior bearish trend was very much driven by the rate cut expectations that are still priced-in, the question must be asked – what could ultimately compel USD bears to come in and sell at or near fresh lows – an item that’s seemingly been missing for the past few months?
As looked at on Monday, I think this boils back to the Euro, and I’ll look at that next.
US Dollar Weekly Chart
Chart prepared by James Stanley; data derived from Tradingview
EUR/USD
The Euro is 57.6% of the DXY quote, and it’s often difficult for one market to trend without the other. In the case of the Euro, the massive sell-off in DXY in the first-half of the year showed alongside a strong rally in EUR/USD, but the pair has been similarly stalled for the past few months despite an open door for bulls to press forward.
The 76.4 and 78.6% Fibonacci retracements remain a big item and I’ve been focusing on those in webinars of late. If we are going to see USD-bears pushing to fresh lows in a continuation trend, we’re probably going to need to see EUR/USD bulls force a breakout that they haven’t been able to hold for the past three months and change.

EUR/USD Weekly Chart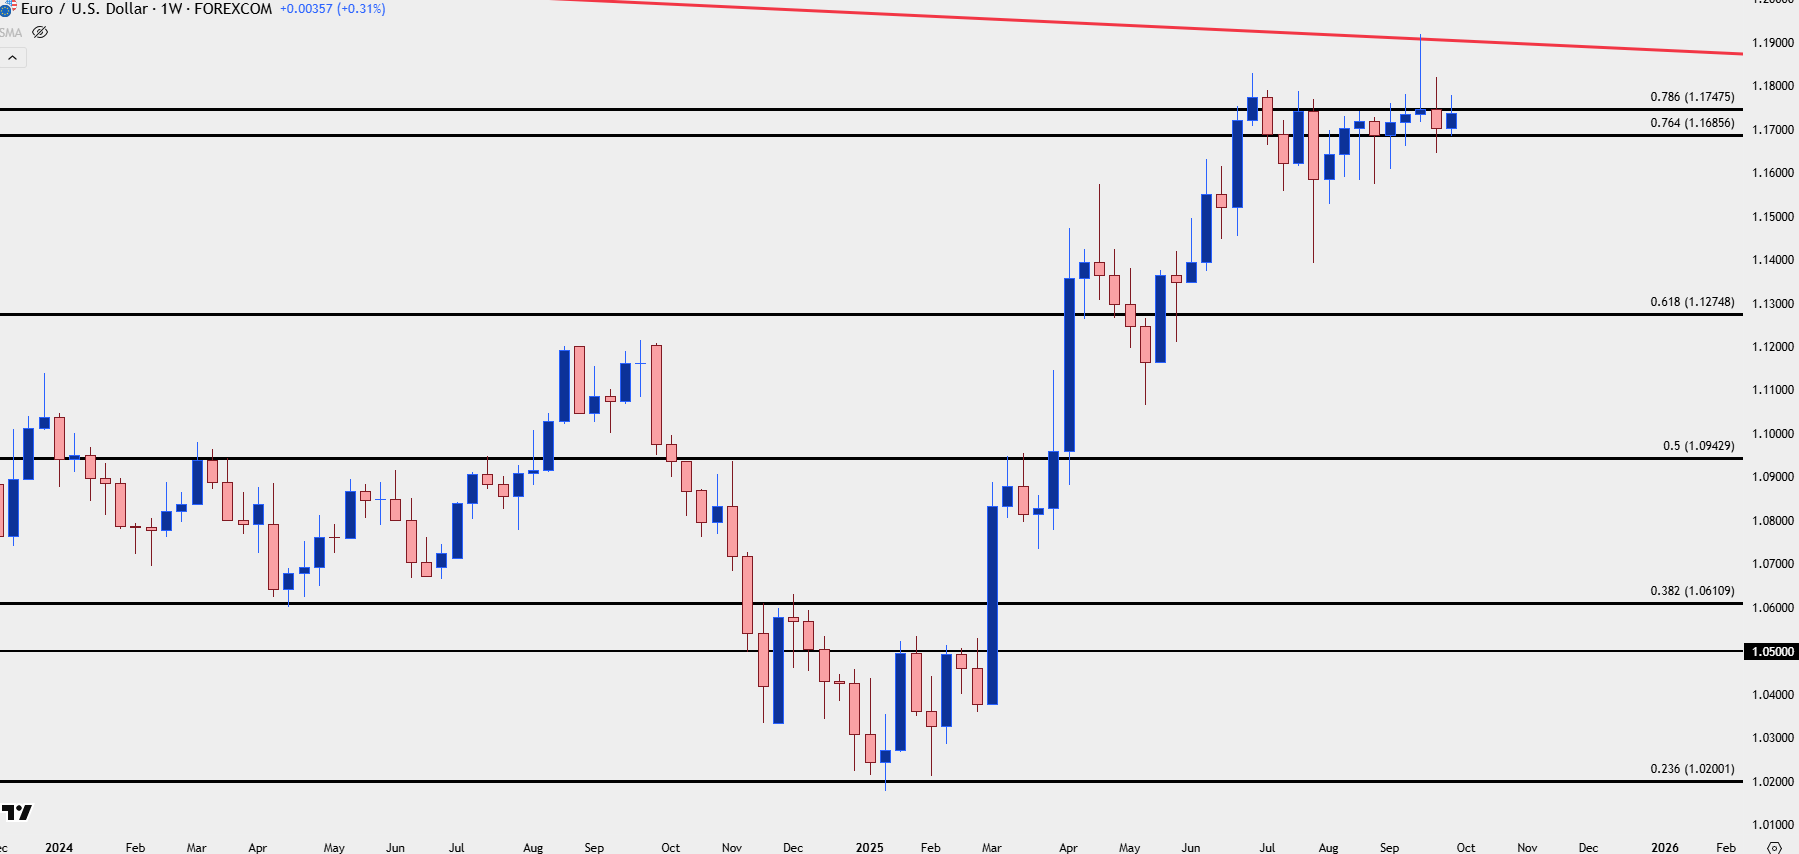
Chart prepared by James Stanley; data derived from Tradingview
GBP/USD
I like GBP/USD a bit more for USD-strength scenarios at this point, and I compared the backdrop in Cable to EUR/USD using a similarly drawn 2021-2022 Fibonacci retracement. While EUR/USD continues to hold below the 78.6% retracement, GBP/USD has built a higher-low off of both the 76.4 and 78.6, which gives a greater appearance of strength on a relative basis.
GBP/USD Daily Chart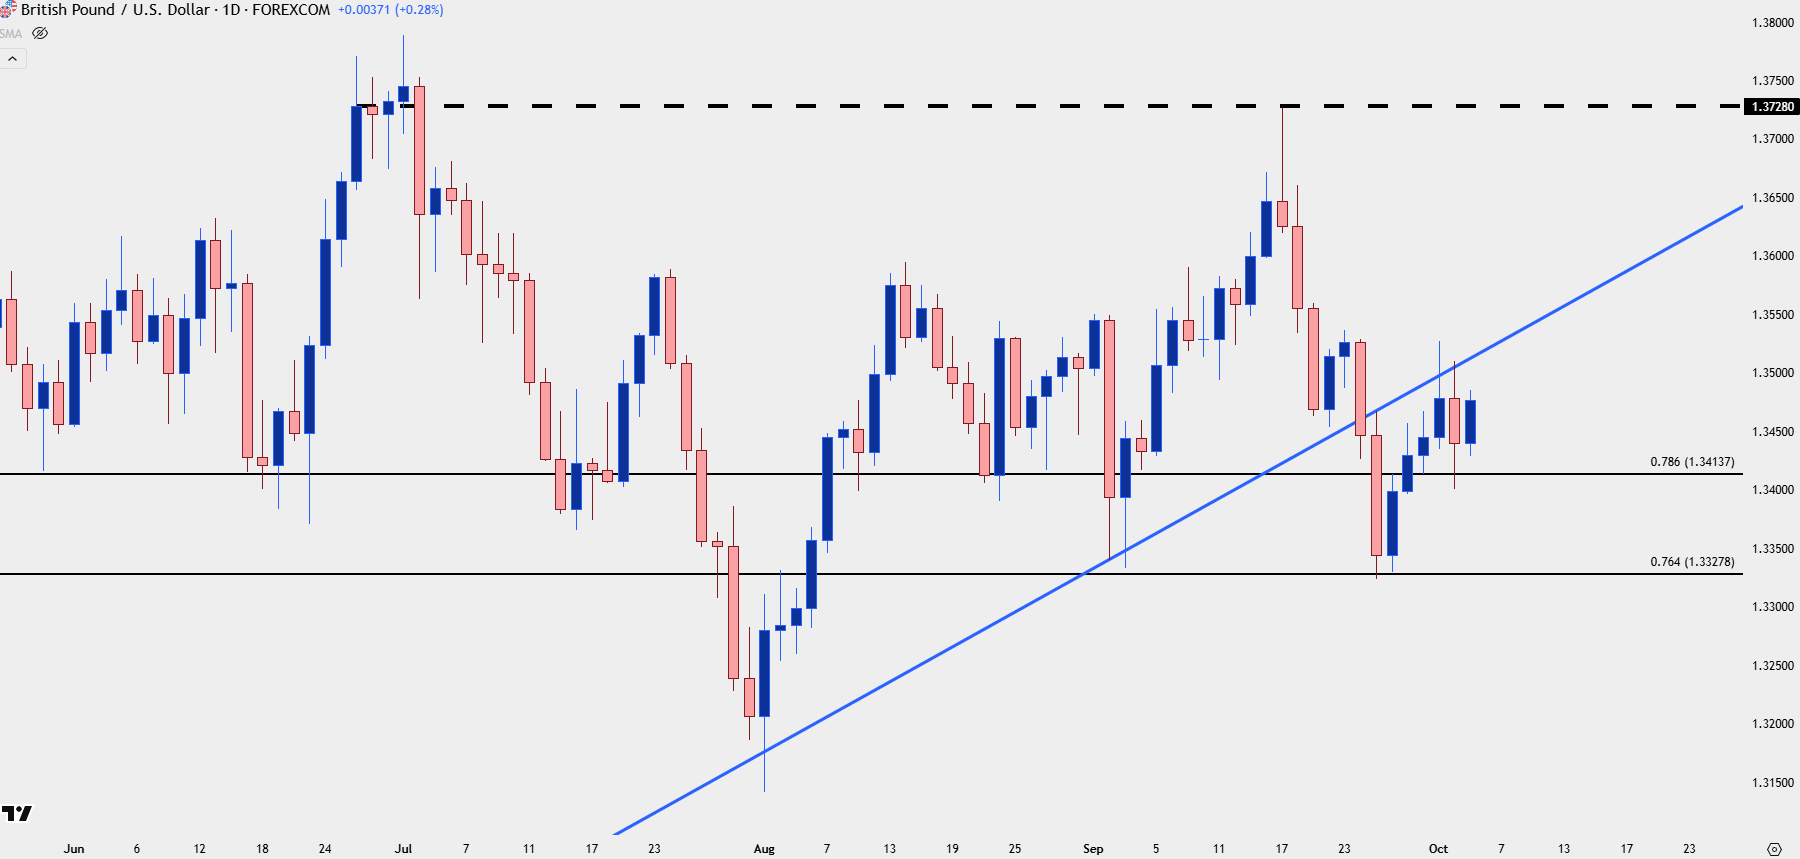
Chart prepared by James Stanley; data derived from Tradingview
USD/JPY
The Yen had a strong four-day outlay that lasted into Wednesday. But, as I looked at on Thursday, USD/JPY is still within the range, and until there’s evidence of break, I’m going to look for that range to continue. There could be a more attractive case for JPY-weakness in EUR/JPY, as I had looked at then.
USD/JPY Daily Chart
Chart prepared by James Stanley; data derived from Tradingview
USD/CAD
USD/CAD is still one of the cleaner majors for USD-strength scenarios, in my opinion. I’ve been following the pair for such for more than a few months now, and as a case in point, even with the USD still relatively close to those three-year lows established at the FOMC rate cut announcement, USD/CAD pushed up to a fresh four-month high this week, and is making a fast push at the 1.4000 handle.
I wrote about the pair on Wednesday, and I’m looking at the pair from the same vantage point as we move into the weekend.
USD/CAD Daily Chart
Chart prepared by James Stanley; data derived from Tradingview
--- written by James Stanley, Senior Strategist




