


FX markets are entering a critical phase as Hormuz disruptions, inflation concerns, and BOJ intervention risks begin to reshape the US dollar outlook.
EURUSD and GBPUSD remain highly sensitive to these shifts, with price action trading near key technical levels that could define the next directional move.
Hormuz tensions and ceasefire violations have now entered their ninth week, adding pressure to the energy shock, global inflation, central bank expectations, and bond yields—factors that continue to drive currency market volatility.
Key events in focus
- The Middle East ceasefire was breached after four weeks of negotiations, reinforcing the US dollar’s safe-haven appeal
- BOJ intervention risks remain elevated, with USD/JPY already experiencing a 400+ point drawdown as Japan signals increased urgency. This dynamic could trigger broader carry trade unwinds across FX markets
- A coordinated hawkish stance from the Fed, ECB, and BOE would likely support continued dollar strength. However, active BOJ intervention could reverse this dynamic, weakening the dollar and lifting both the euro and the pound
- Multiple macro drivers, including the global energy shock, inflation data, and shifting rate expectations, are converging. In this environment, long term levels, price action, and investor positioning remain key leading indicators
EURUSD Price Outlook: Weekly Time Frame – Log Scale

Source: Trading view
EURUSD remains confined within a consolidation range between September 2025 and May 2026, with resistance between 1.1900–1.2000 and support between 1.1400–1.1300.
This structure defines two key scenarios:
Bullish scenario:
A sustained close above 1.1930 would confirm a breakout, exposing upside targets at 1.2130, 1.2350, and 1.2580. These levels align with highs last seen in 2021 and 2018 and are derived from Fibonacci extensions of the 2025–2026 price cycle. (the wave spanning the 2025 low (1.1017), 2026 high (1.2080), and subsequent pullback to 1.1400).
Bearish scenario:
A sustained close below 1.1660 would increase downside pressure toward 1.1590, 1.1440, and 1.1330. A deeper move could extend toward 1.1180 and 1.1000, aligning with the upper bound of the long-term (2008–2025) down trending parallel channel.These levels are derived from Fibonacci extensions of the 2026 price structure.
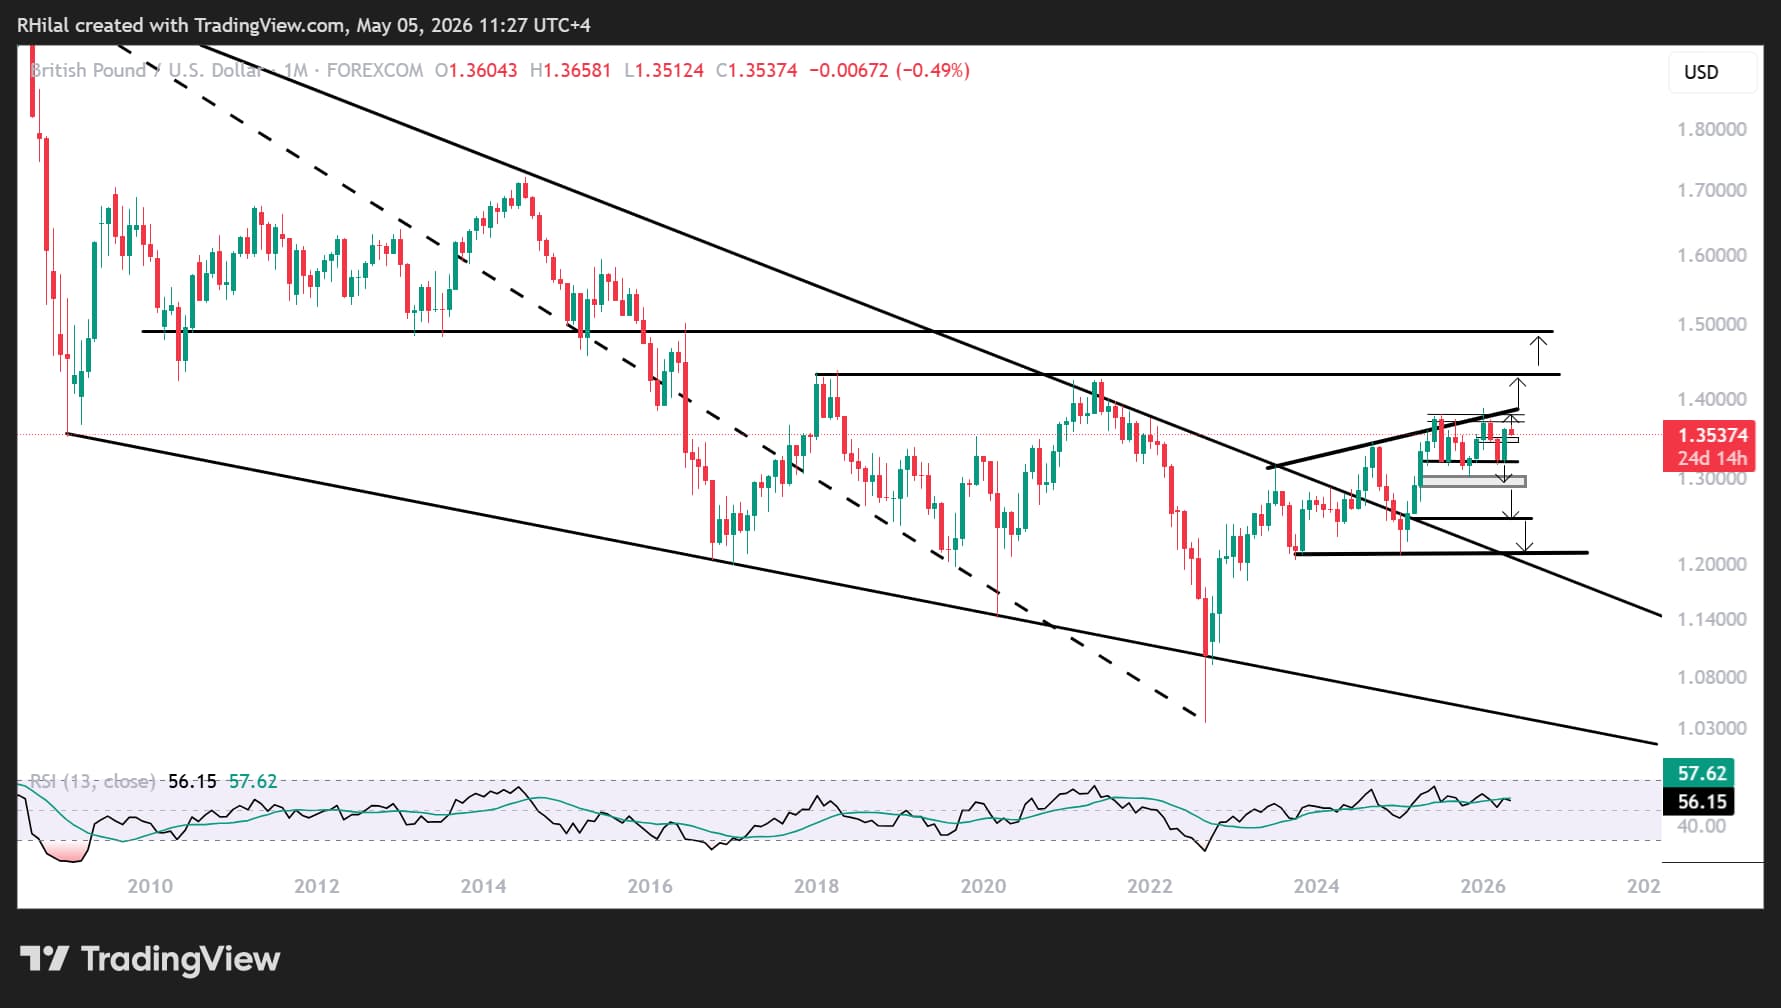
GBPUSD Price Outlook: Weekly Time Frame – Log Scale
Source: Trading view
GBPUSD shows a similar structure, reflecting its sensitivity to US dollar dynamics, geopolitical risks, and potential BOJ-driven carry trade unwinds.
The pair remains within a broad consolidation between June 2025 and May 2026, capped below 1.3800 and supported above 1.3000.
Bullish scenario:
A close above 1.3640 would trigger a retest of the July 2023–January 2026 resistance line near 1.3830. A breakout above this level could extend gains toward 1.4300 and 1.4900, levels last seen in 2021 and 2016.
Bearish scenario:
A close below 1.3440 would expose downside targets at 1.3380 and 1.3220. Further weakness could extend toward 1.3100, 1.2940, 1.2770, and 1.2500—aligning with the upper bound of the long-term consolidation and the 1.618 Fibonacci extension of the 2026 structure (2026 low - 2026 high - and April 2026 high).
Upcoming US NFP data, leaning towards a drop from 178k to 64k, further Middle East developments, and next week’s CPI release, leaning towards higher rates, are likely to drive near-term volatility.
With multiple macro forces at play, focusing on key technical levels remains essential to filter out short-term noise and identify structural trend shifts.
Written by Razan Hilal, CMT
Follow on X: @rh_waves




