It is becoming a challenging period for gold price action in the short term, as the metal has not been able to build enough strength to sustain a solid bullish move. In fact, over the last three trading sessions, gold has posted a decline of nearly 2.00%, starting to reflect a short-term weakness scenario.
Now, buying activity in the gold market remains quite limited, not only due to the increase in risk appetite, but also because of the dynamics in U.S. bond yields, which have been weighing on the metal’s ability to extend its gains. As long as both the bond market and risk appetite remain firm, the sense of indecision around gold may continue to gain relevance in the coming sessions.

Rising confidence fails to support demand
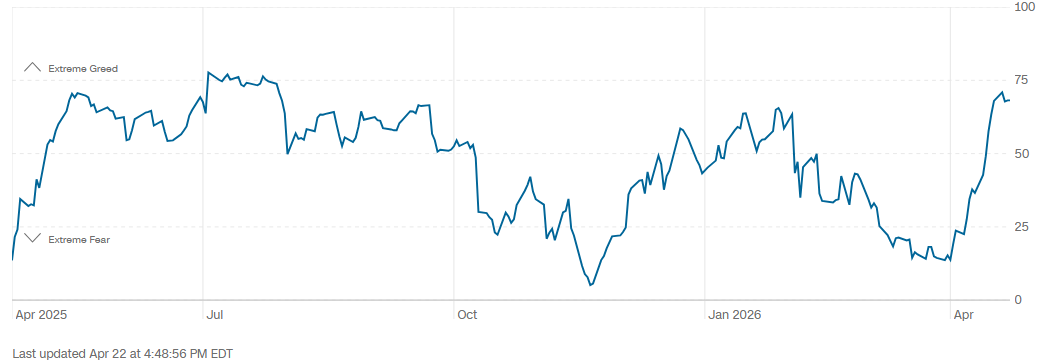
Despite ongoing commentary surrounding the Middle East conflict, expectations remain that the United States and Iran could move toward a potential round of peace negotiations in the short term. This has helped keep market confidence indicators in stable territory. In fact, CNN’s Fear and Greed Index continues to show an upward slope, with readings approaching the 75-point area, which marks the threshold of “extreme greed.” This suggests that market sentiment remains stable in the short term.
Source: CNN
This development is relevant because market participants appear to be reallocating capital flows toward traditional risk assets, reducing interest in safe-haven assets such as gold. While rising confidence could typically be seen as supportive, in this case it is benefiting other markets that appear more attractive in the short term.
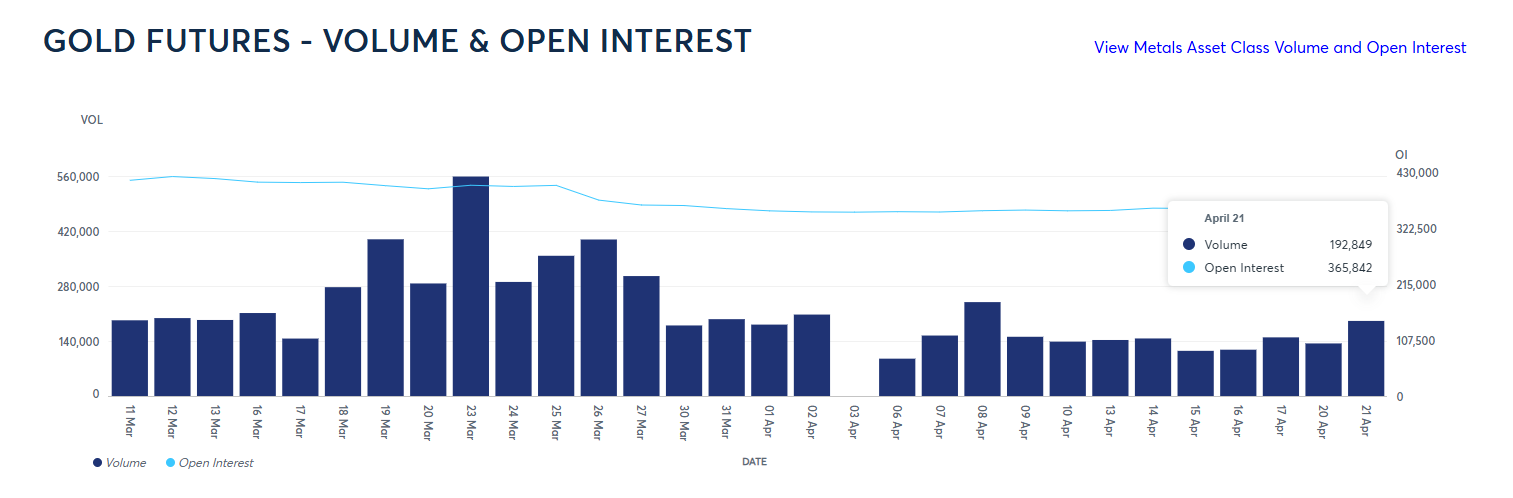
This is also reflected in the volume dynamics of the gold futures market in recent sessions. Data through April 21 showed a slight increase in volume, surpassing 365,000 contracts traded. However, higher volume does not necessarily imply stronger demand. In fact, when comparing April’s average daily volume with that of March, there is a gradual decline in activity, suggesting lower market participation. This can be interpreted as a lack of demand strength, rather than a buildup of buying interest, reinforcing a scenario of neutrality and potential capital rotation toward other assets.
Source: CMEGROUP
Taking all of this into account, the increase in confidence has not benefited gold as might be expected, as it has not translated into a meaningful rise in demand. As long as risk appetite continues to gain ground, indecision in XAU/USD may remain a dominant factor in the coming sessions.
Bond market behavior also remains relevant
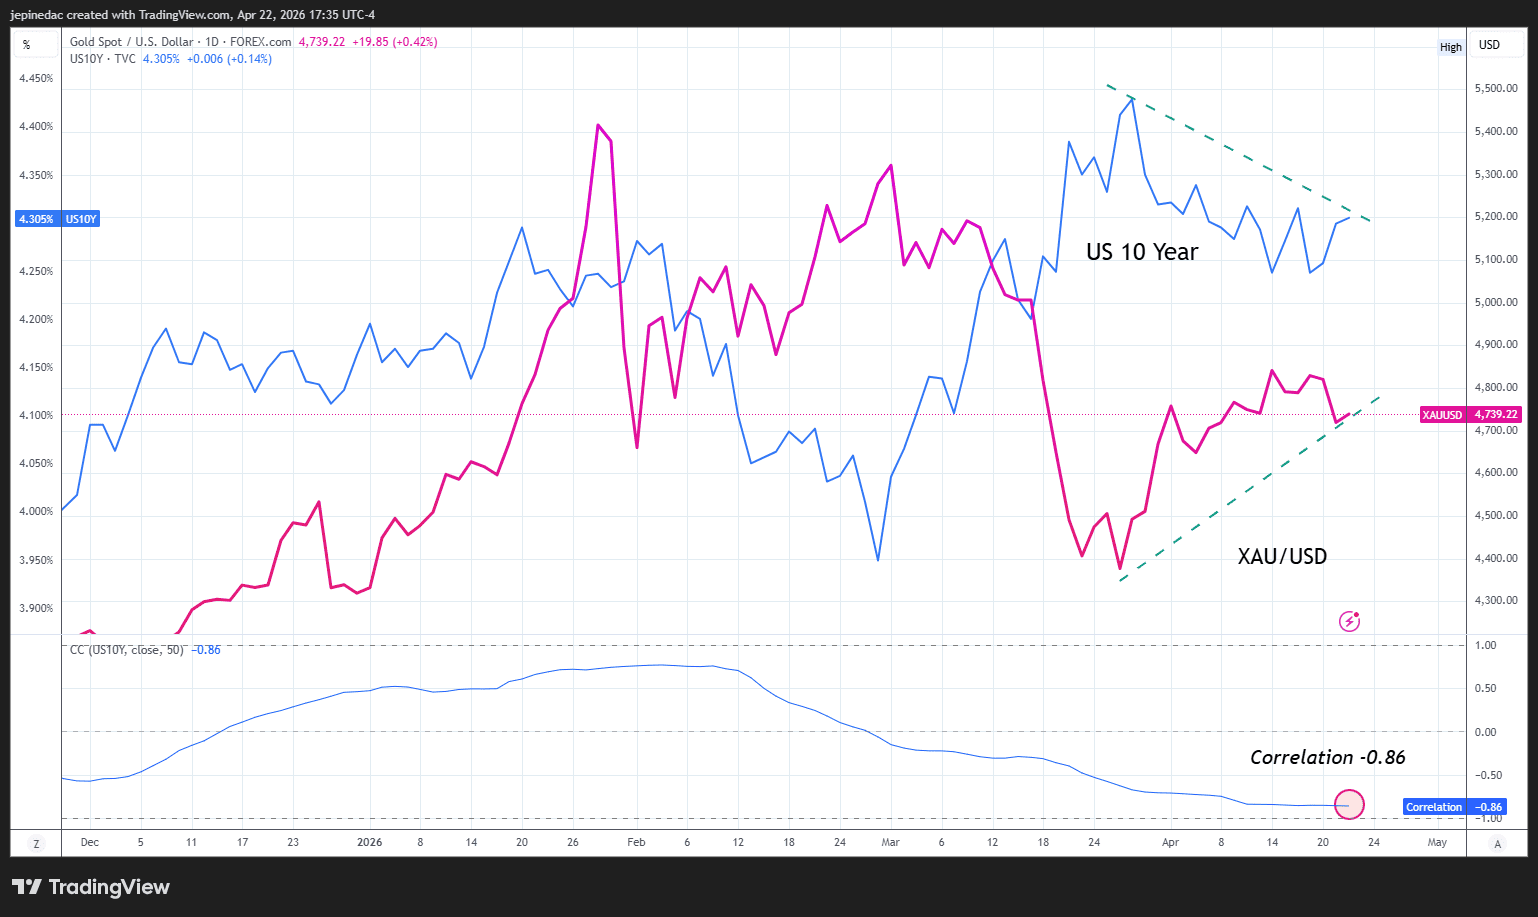
Another key factor to consider is the behavior of the U.S. 10-year Treasury yield, which is regarded as one of gold’s main substitute assets. Over the last 50 trading sessions, the correlation between gold and bond yields stands at -0.86, reflecting a strong negative correlation—as yields rise, gold tends to weaken. It is important to note that this correlation can change over time.
Source: TVC, StoneX, Tradingview
This relationship becomes clearer when observing that, as yields declined, gold found favorable conditions to rally. However, in the current environment, where yields have stabilized around the 4.3% level, gold has once again started to show neutral price behavior.
Unless a more consistent decline in bond yields emerges, the indecision phase is likely to remain relevant in XAU/USD price action in the short term.
Technical outlook for Gold
Source: StoneX, Tradingview
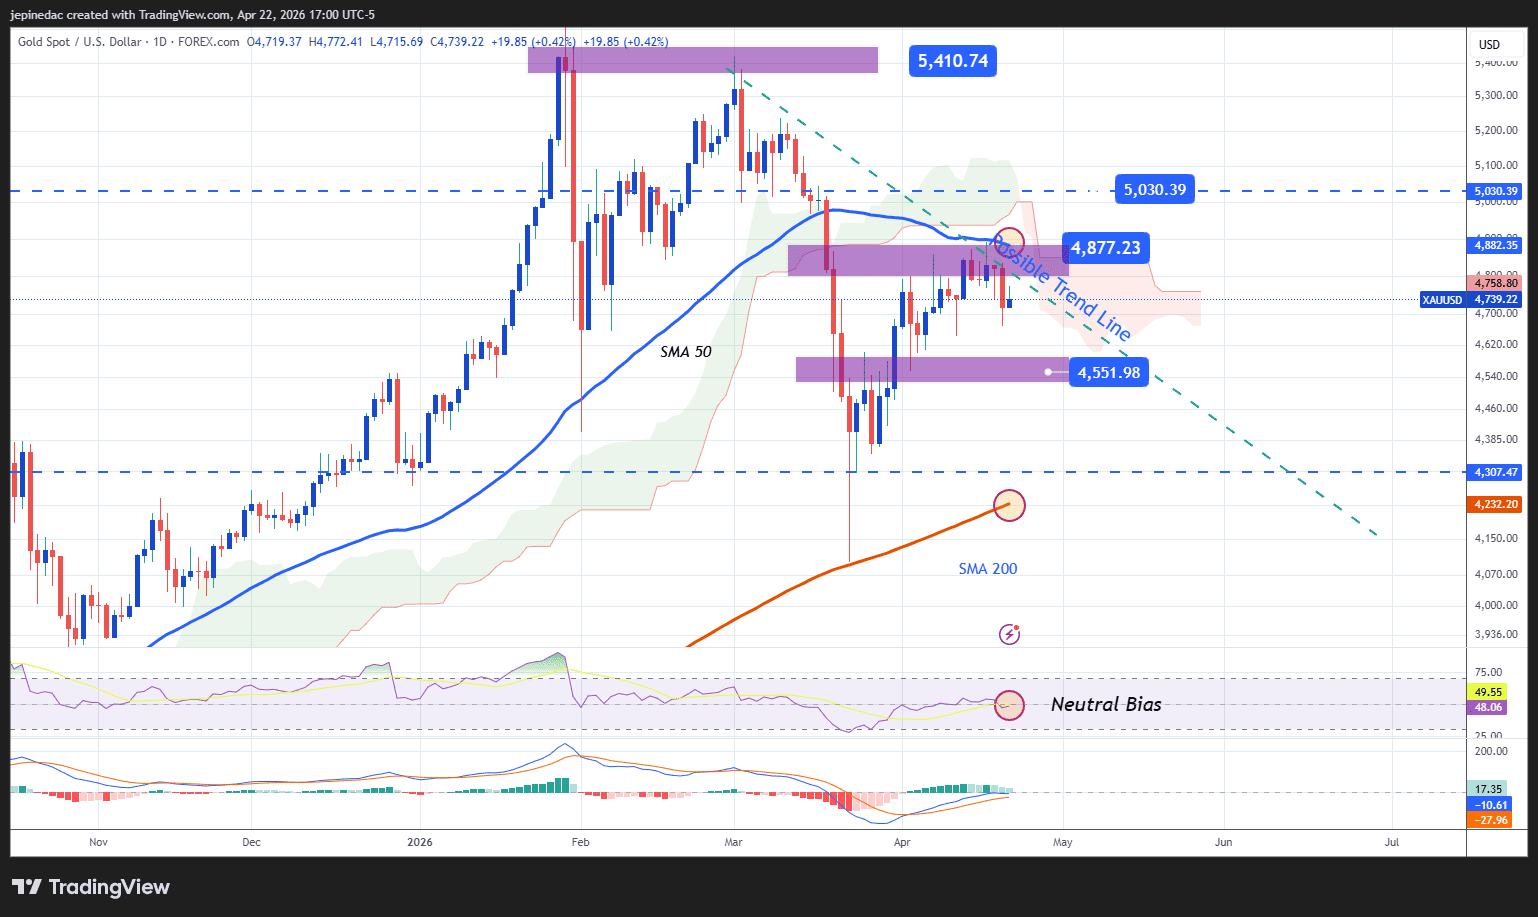
- A bearish trendline begins to emerge: Recent gold price action has started to pave the way for the possible formation of a short-term bearish trendline. So far, the price has not shown enough strength to invalidate this potential structure. Therefore, if selling pressure continues to build, this could become the main technical pattern to monitor in the coming weeks.
- RSI: The RSI line remains close to the 50 level, suggesting a balance between buying and selling forces. This supports the idea that the market is currently in a neutral phase, which could continue to dominate in the short term.
- MACD: A similar scenario is observed in the MACD, where the histogram remains around the zero level, reflecting a balance in short-term moving averages. As long as this dynamic persists, market indecision is likely to remain relevant in gold price action.
Key levels to watch:
- 5,000 USD – Key resistance: A major psychological level acting as the primary upside barrier. A move back toward this zone could reestablish a dominant bullish bias and open the door for a new uptrend, invalidating the current bearish structure.
- 4,877 USD – Near-term barrier: A key neutral zone, aligned with the 50-period simple moving average. Price action around this level could reinforce a more defined sideways phase in the short term.
- 4,550 USD – Key support: A level representing recent significant lows. A move toward this area could bring back strong selling pressure and reinforce a bearish trend in the short term.
Written by Julian Pineda, CFA, CMT – Market Analyst
Follow him on: @julianpineda25