



Bulls have been back on the bid in gold following the stunning sell-off that developed in late-January. There’s still some time to go until the weekly close but at this point buyers are vying for a fourth consecutive week in the green after the pullback that spanned more than $1200 in a violent scenario.
The big item from this week has been a bullish break of the 5100 level, which was a spot of prior resistance-turned-support that later came in to mark resistance for an ascending triangle formation that we’ll look at in a moment.
For the past few weeks, I’ve been using short-term setups in gold as example of how to use price action in trading strategy, and this week’s focus was on that 5100 level but this time as support.
Gold Weekly Chart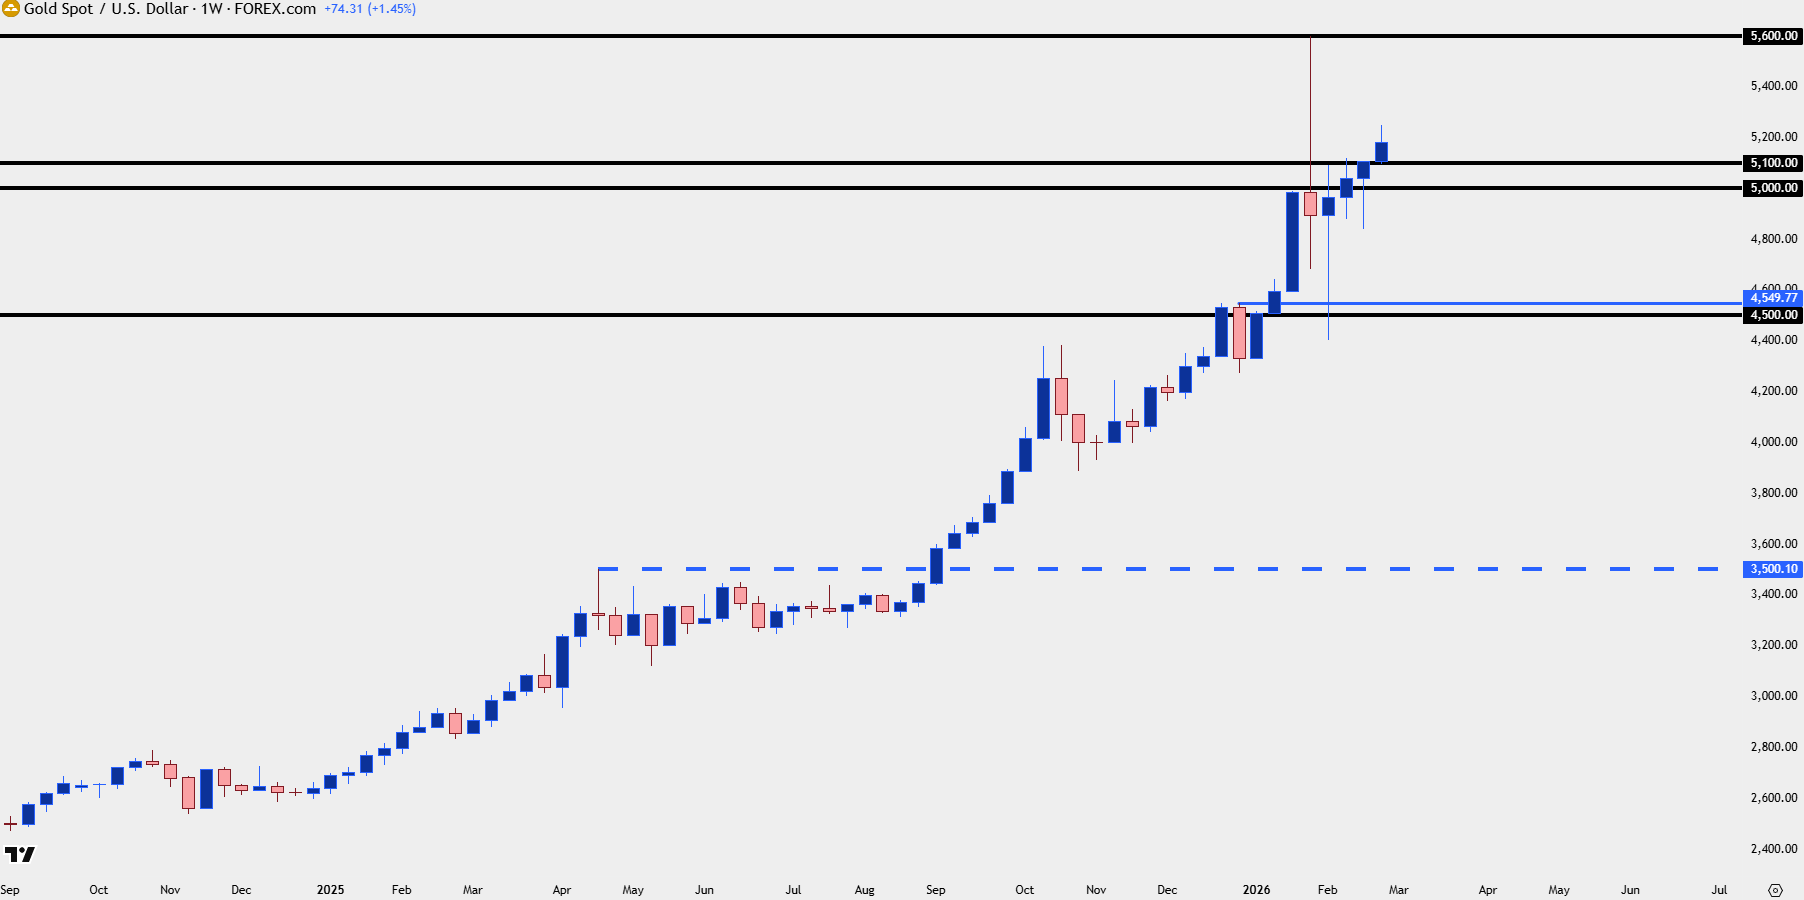
Chart prepared by James Stanley; data derived from Tradingview
Gold: Life Cycle of a Trend
After the initial shock of the sell-off gold prices rallied up until the 5100 level came in as resistance. The next test of that same level a week later brought a similar response, with sellers defending that spot – but it was what happened after that which remained of interest, as a higher-low developed that set the initial stages of an ascending triangle formation.
That resistance held into the close of last week, following another defense of the $5k psychological level, and to begin this week, bulls were finally able to push a breakout with prices running up to the 5238-5270 zone of resistance.
And the initial pullback from that has so far held support at prior resistance, at the same 5100 zone, and this keeps bulls in the driver seat for near-term trends.
Gold Four-Hour Price Chart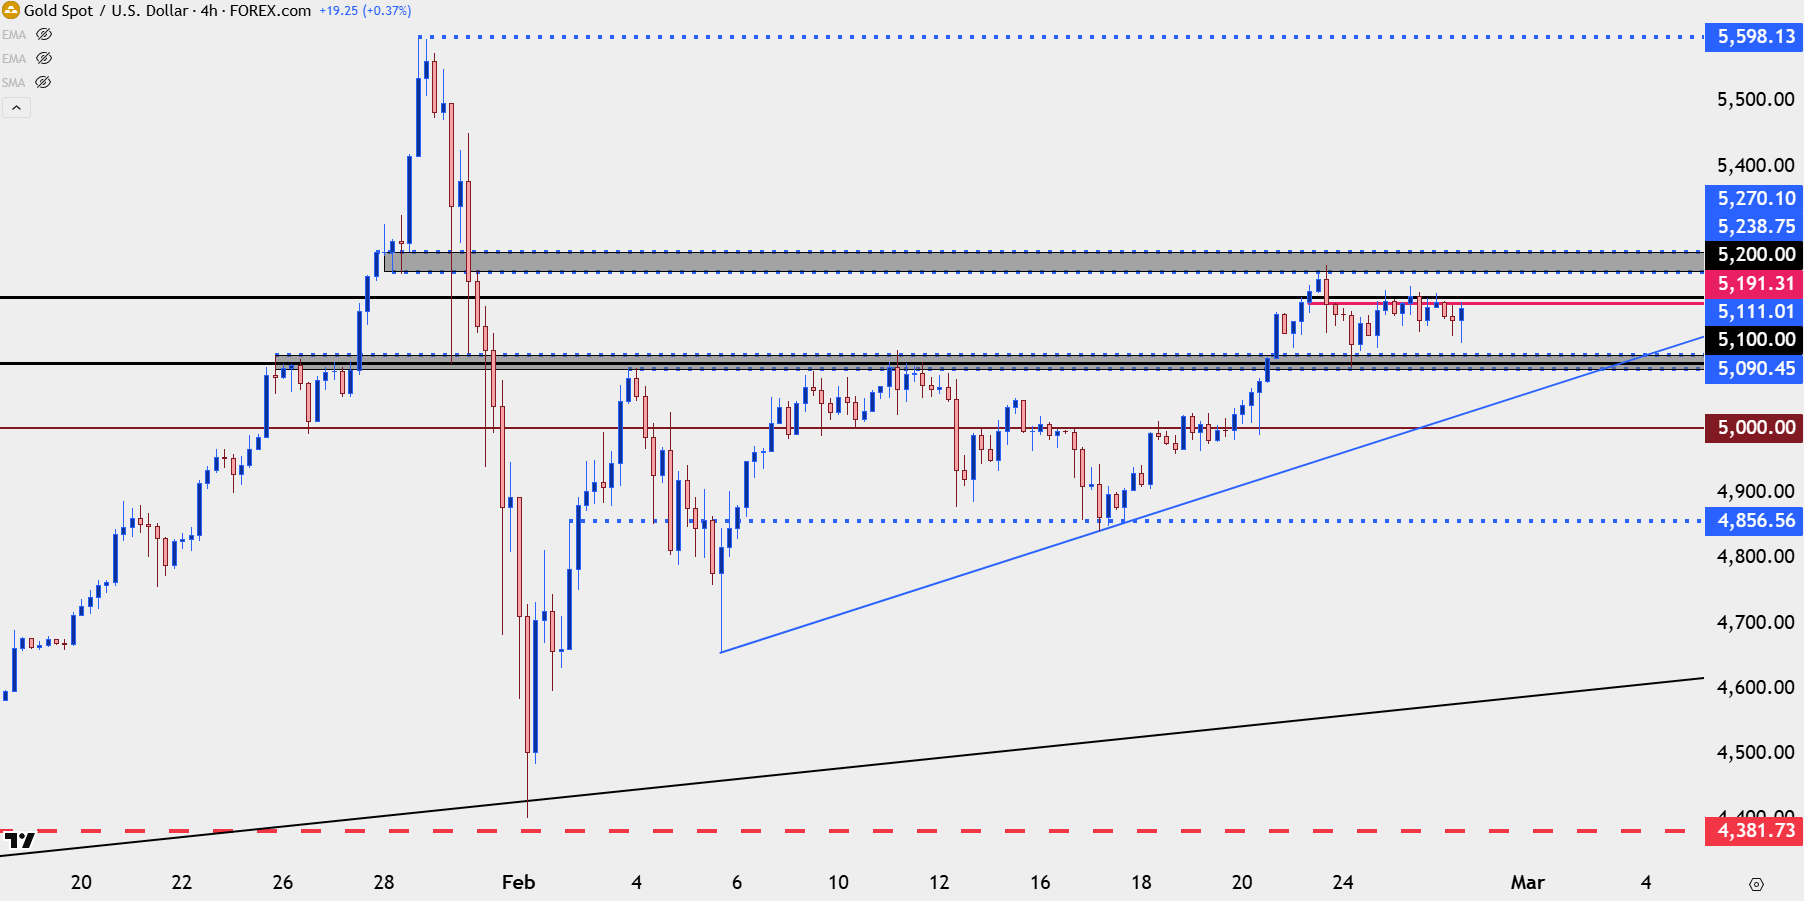
Chart prepared by James Stanley; data derived from Tradingview
Gold Grind
On a shorter-term basis gold price action is messy. We had the resistance test on Monday and the support test on Tuesday, and since then it’s been a grinding matter with little symmetry or formality.
When presented such a backdrop traders have a couple of options: Either try to play inside of the sloppy price action or to wait for matters to clean up. The latter approach presents more clarity as traders can essentially wait for a support test in that same zone, with preference towards a higher-low above the Tuesday swing, in order to look for bullish setups. The top of that zone is at 5111 and the Monday low at 5093, so even a test of the 5100 level could be argued as a higher-low and something that opens the door for a bounce.
I’d still be cautious of trying to get too bearish on gold but for those that do want to push the approach, the resistance at 5238 has been fairly clear and there’s even chance of a 5200 resistance hold. For that, traders would probably want to see an upper wick on an hourly or four-hour candle to illustrate a reaction, and the drive for such a play would likely be anticipation of some profit taking from longs ahead of the weekend.
Gold Hourly Price Chart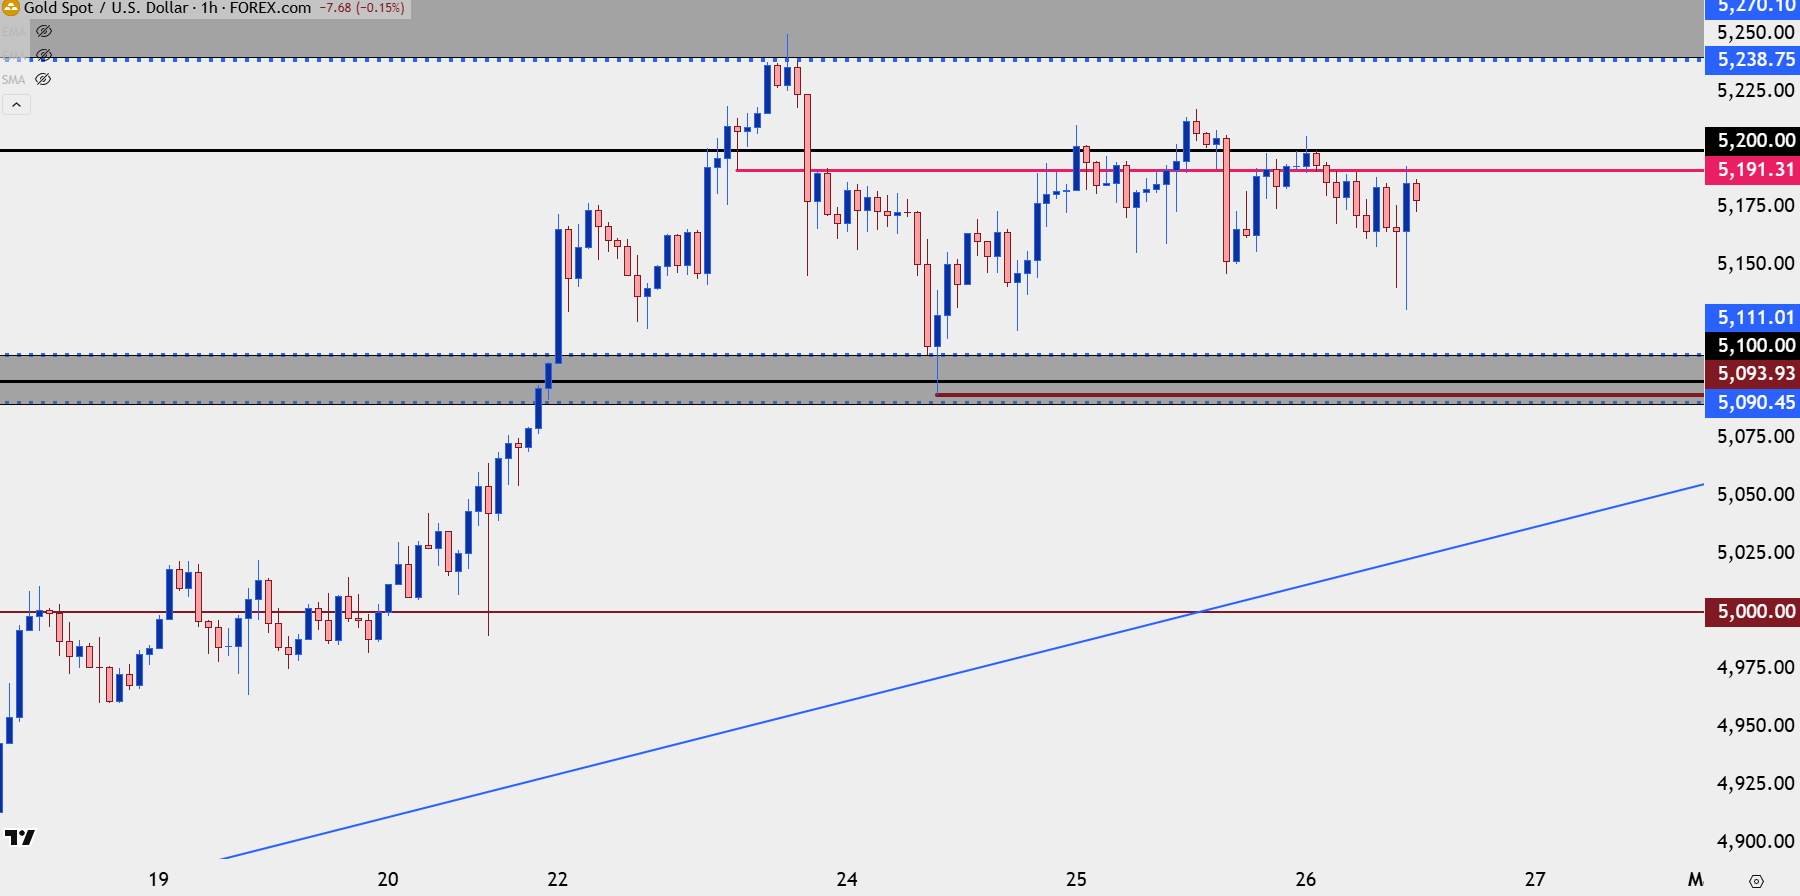
Chart prepared by James Stanley; data derived from Tradingview
--- written by James Stanley, Senior Market Analyst, Global Macro




