
Gold has been relatively quiet this week as the metal attempts to hold above the $4k psychological level. So far, that level has been unable to hold the lows but there is a pattern of higher-lows from last week’s sell-off that bulls can be optimistic about. And from the weekly chart, there’s indecision showing currently to go along with that higher-low; if we do finish the week with a doji or even a spinning top, topside reversal potential can become attractive based on the first two steps of a morning star formation being in-play.

All factors held equal, the pullback in gold has been relatively light, at this point. Normally with a parabolic run of that nature there’ll be more profit taking when the trend does inevitably stall and pull back. But, to this point, sellers have been largely held in check above the $3900 level that came into play last Tuesday morning, which has since been followed by a higher-low later last week and then another higher-low so far this week.
It’s the $4k level that continues to loom large as gold attempts to gain acceptance above the big figure. The sell-off last week after the test above shows how that price led to profit taking from buyers; but perhaps the more encouraging part of that is the fact that the corresponding pullback could not establish a fresh low. The next test above $4k earlier this morning again saw profit taking from buyers, but there’s now the prospect of a short-term bullish trend following that higher-low and we’re seeing the $3975 level in-play as a support test.
Gold Four-Hour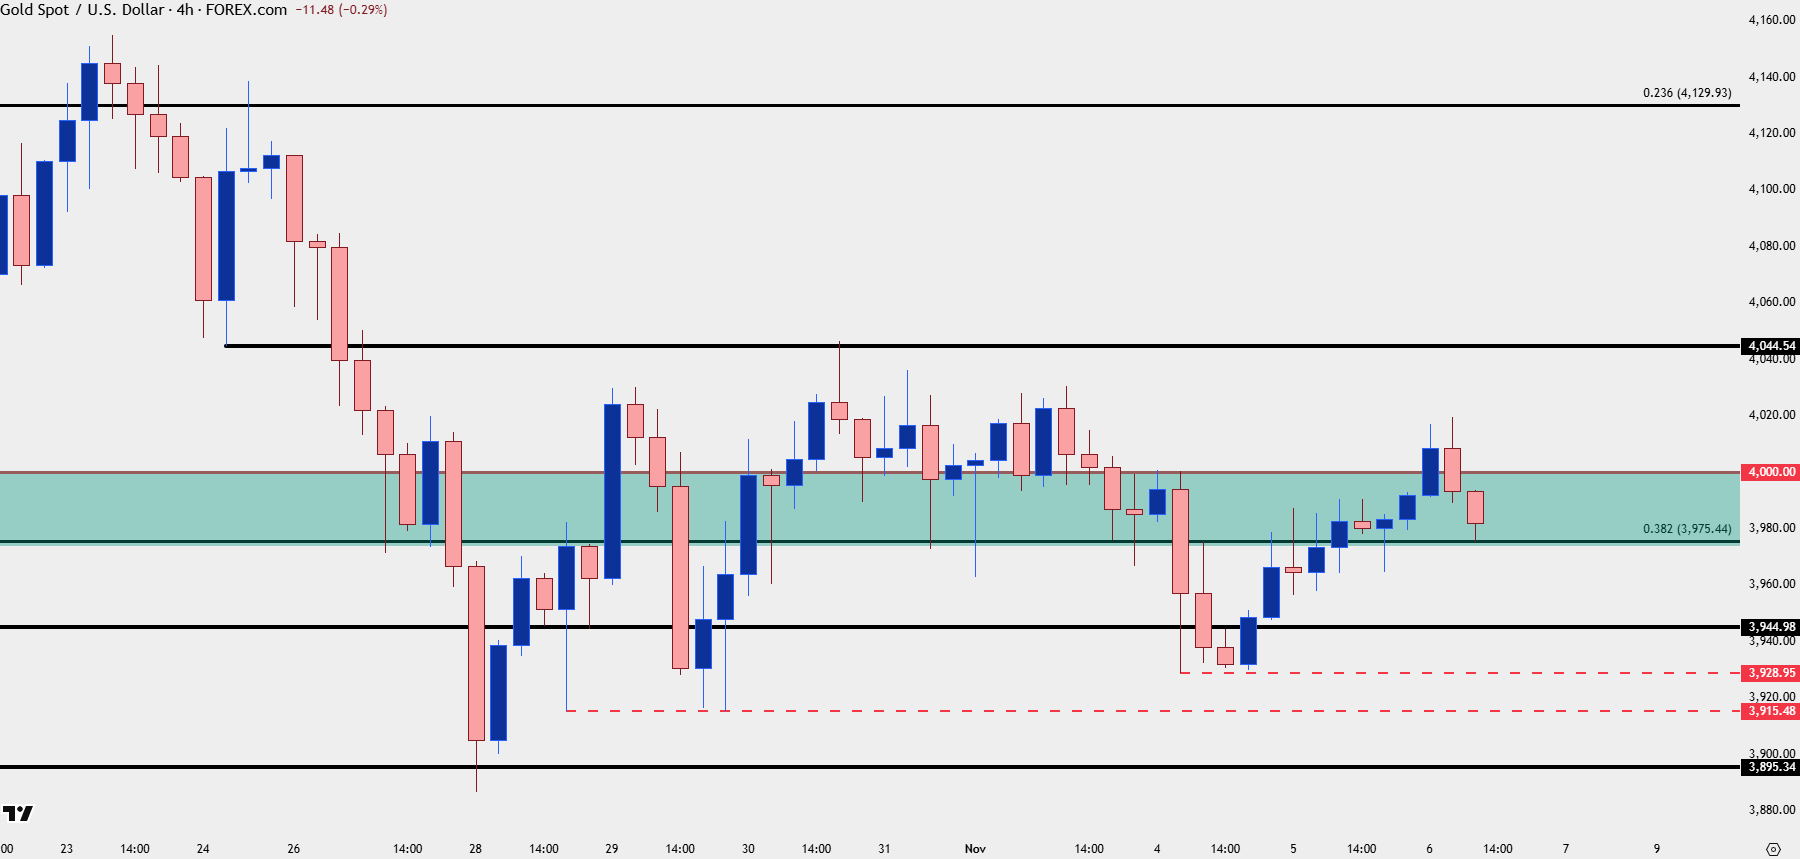
Chart prepared by James Stanley; data derived from Tradingview
Gold Big Picture
In the year and a half since the currently run in gold began following a two-day test of the $2k level, there have been two clear periods of consolidation: The last two months of last year and then a four-month span from late-April and into late-August, right around Jerome Powell’s speech at Jackson Hole. Each setup in a symmetrical triangle which made for bull pennants, and both resolved in a very bullish manner.
The sample size is small, to be sure, but so far the two week sell-off that’s pushed prices back to the $4k handle bears some resemblance to each of those, highlighting the fact that for now, this appears to be a pullback in a broader bullish theme with lacking evidence of a larger reversal at-play.
This also places emphasis on the current weekly bar, as holding a higher-low while printing with indecision following that two-week sell-off can be construed as a significant item of change, which could usher in a short-term rally. That doesn’t necessarily mean fresh all-time-highs, as we can see from the prior two periods of consolidation, where prices digesting with both higher-lows and lower-highs until there was proper motive for bulls to stage a breakout; but it could afford the opportunity to trade mean-reversion with the prior trend-side bias, and if the breakout does take hold then the setup resolves in an even more attractive manner.
Gold Weekly Chart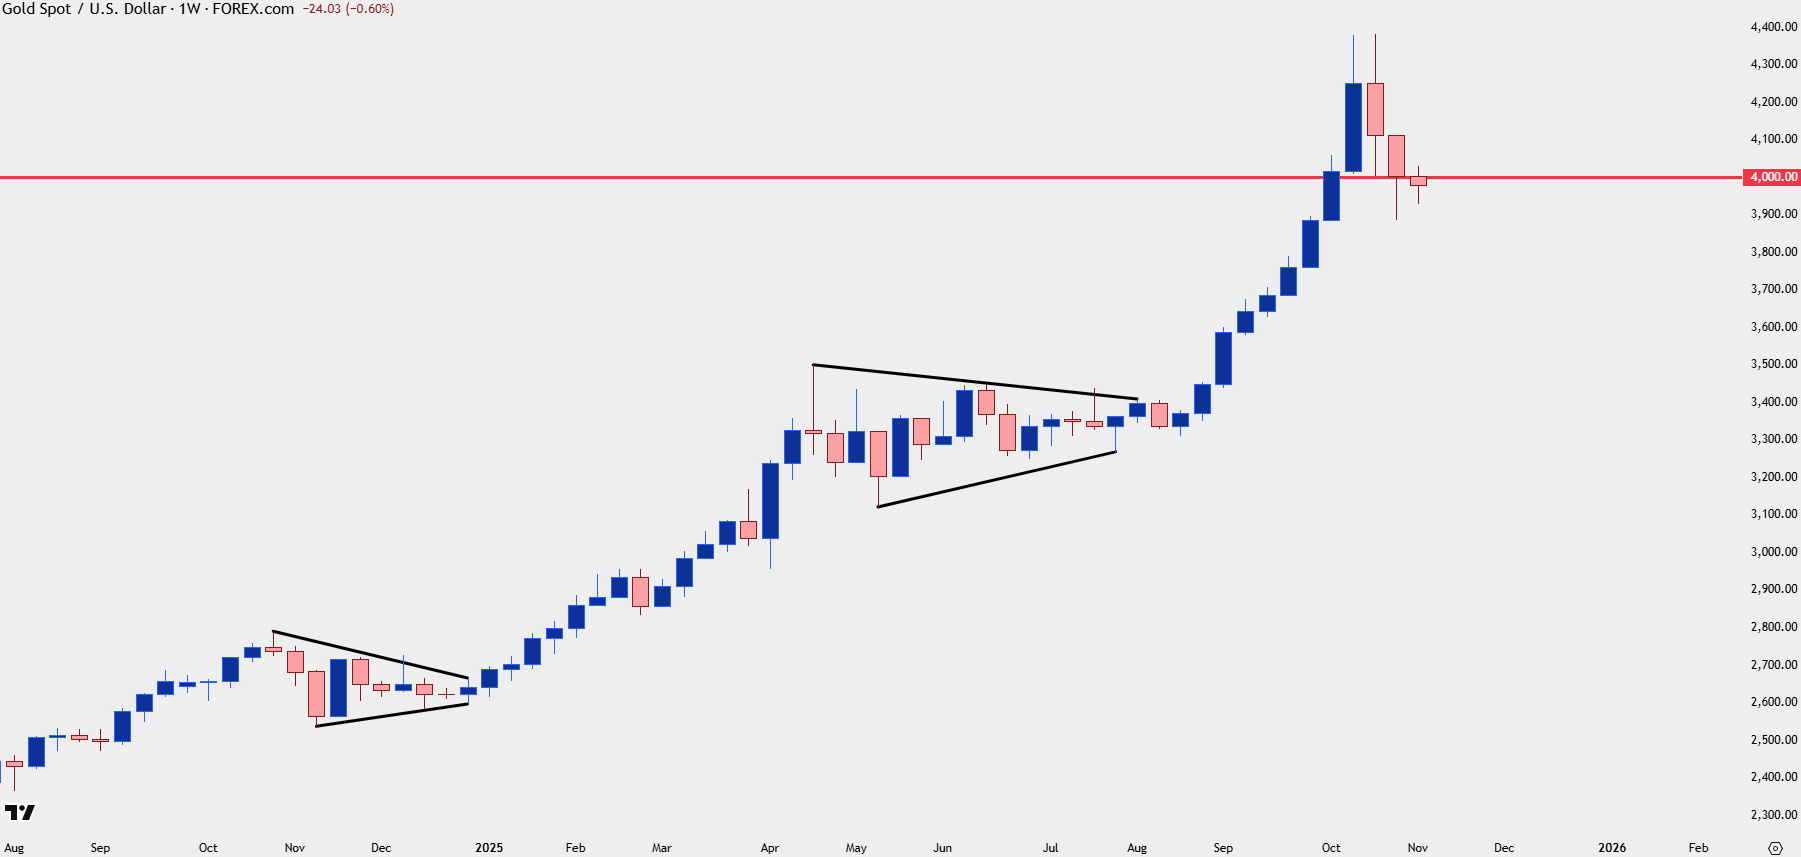
Chart prepared by James Stanley; data derived from Tradingview
Gold Daily
The daily chart of gold doesn’t yet show that buyers are ready to take control, only the simple deduction that sellers have been thwarted at a higher-low so far. But key for shorter-term dynamics is whether bulls can regain footing above that $4k level and perhaps more importantly, the $4044 level, which is a swing of support-turned-resistance last Friday. A break above that would denote a short-term higher-high and that would re-open the door for bulls top ush up to the $4130 Fibonacci level. In that scenario, $4044 could be re-purposed as support from prior resistance.
For bearish scenarios, it’s that $3895 level that stands out as this was a swing-high in late-September that has so far come into hold the pullback move with last week’s lows. If that gets taken out, especially if it gets taken out by the end of this week which would illustrate a fresh lower-low on the weekly bar, the deeper drawdown scenario becomes more attractive. This would point to an initial test of $3850, after which support at $3725 would come into the picture and ultimately, it’s that $3500 level that held resistance back in April that would stand out if sellers do take a larger swing.
Gold Daily Chart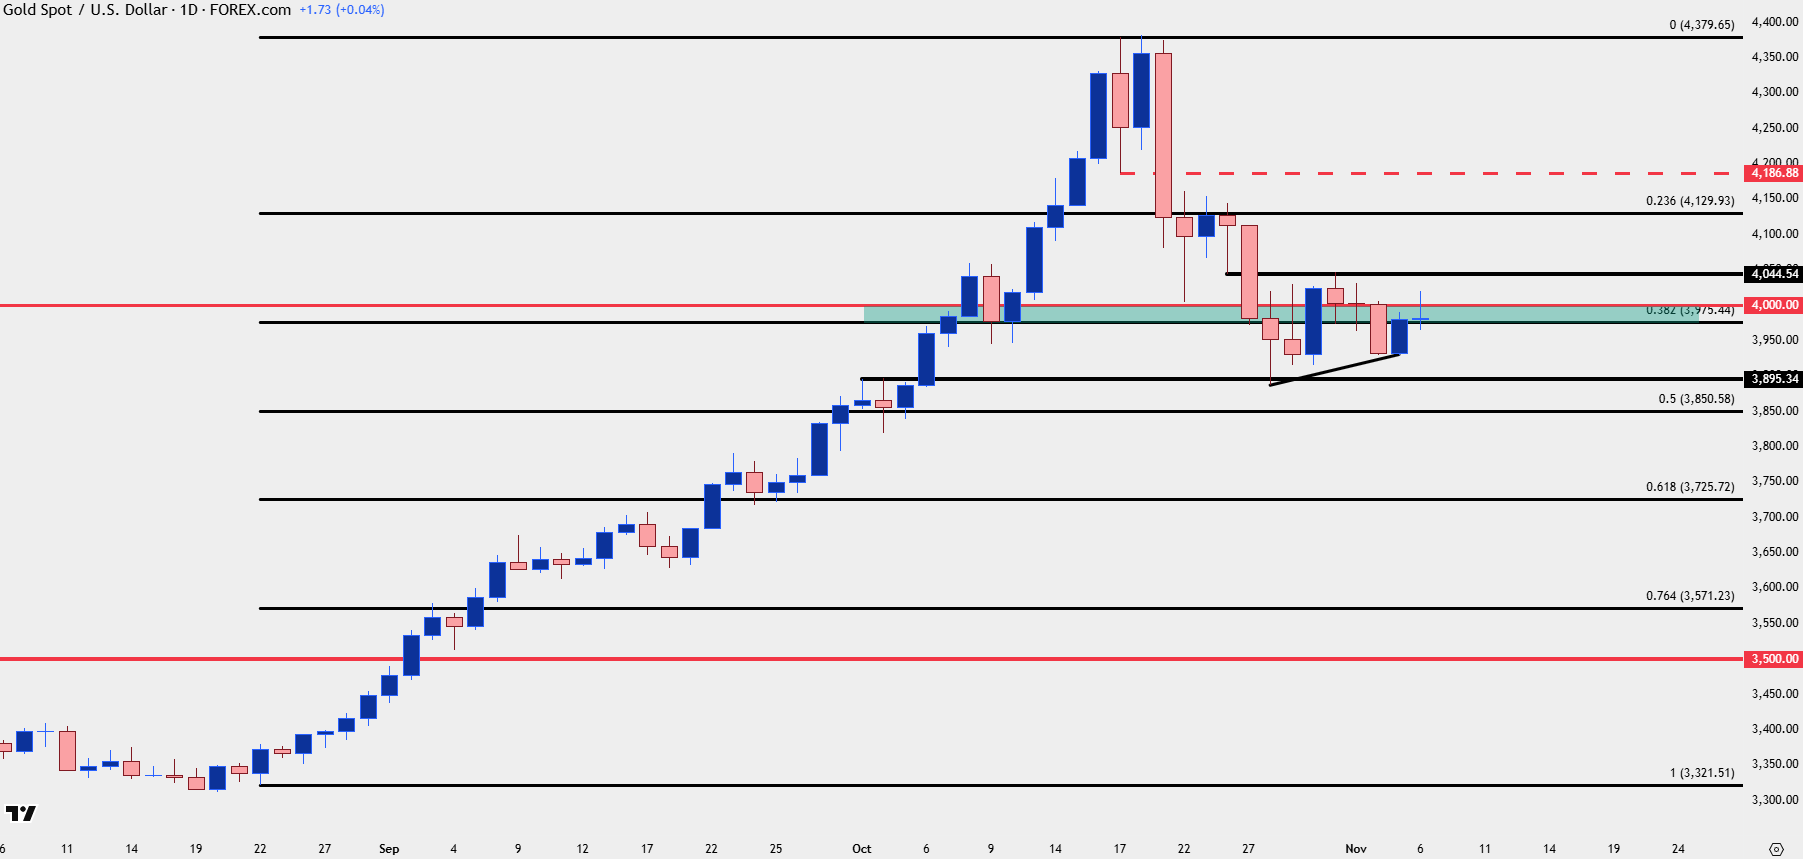
Chart prepared by James Stanley; data derived from Tradingview
--- written by James Stanley, Senior Market Analyst, Global Macro