The weekly chart is currently showing as a bearish engulf in gold and this stands in stark contrast to how the week had started, with an initial rally on the back of geopolitical tensions that saw the metal press up to the $5400 level, albeit temporarily. That level is where the music stopped on the long side as prices then began a pullback that eventually drove back to a clean re-test of the $5k psychological level on Tuesday morning which, so far, has held the lows for the week.
Gold Four-Hour Price Chart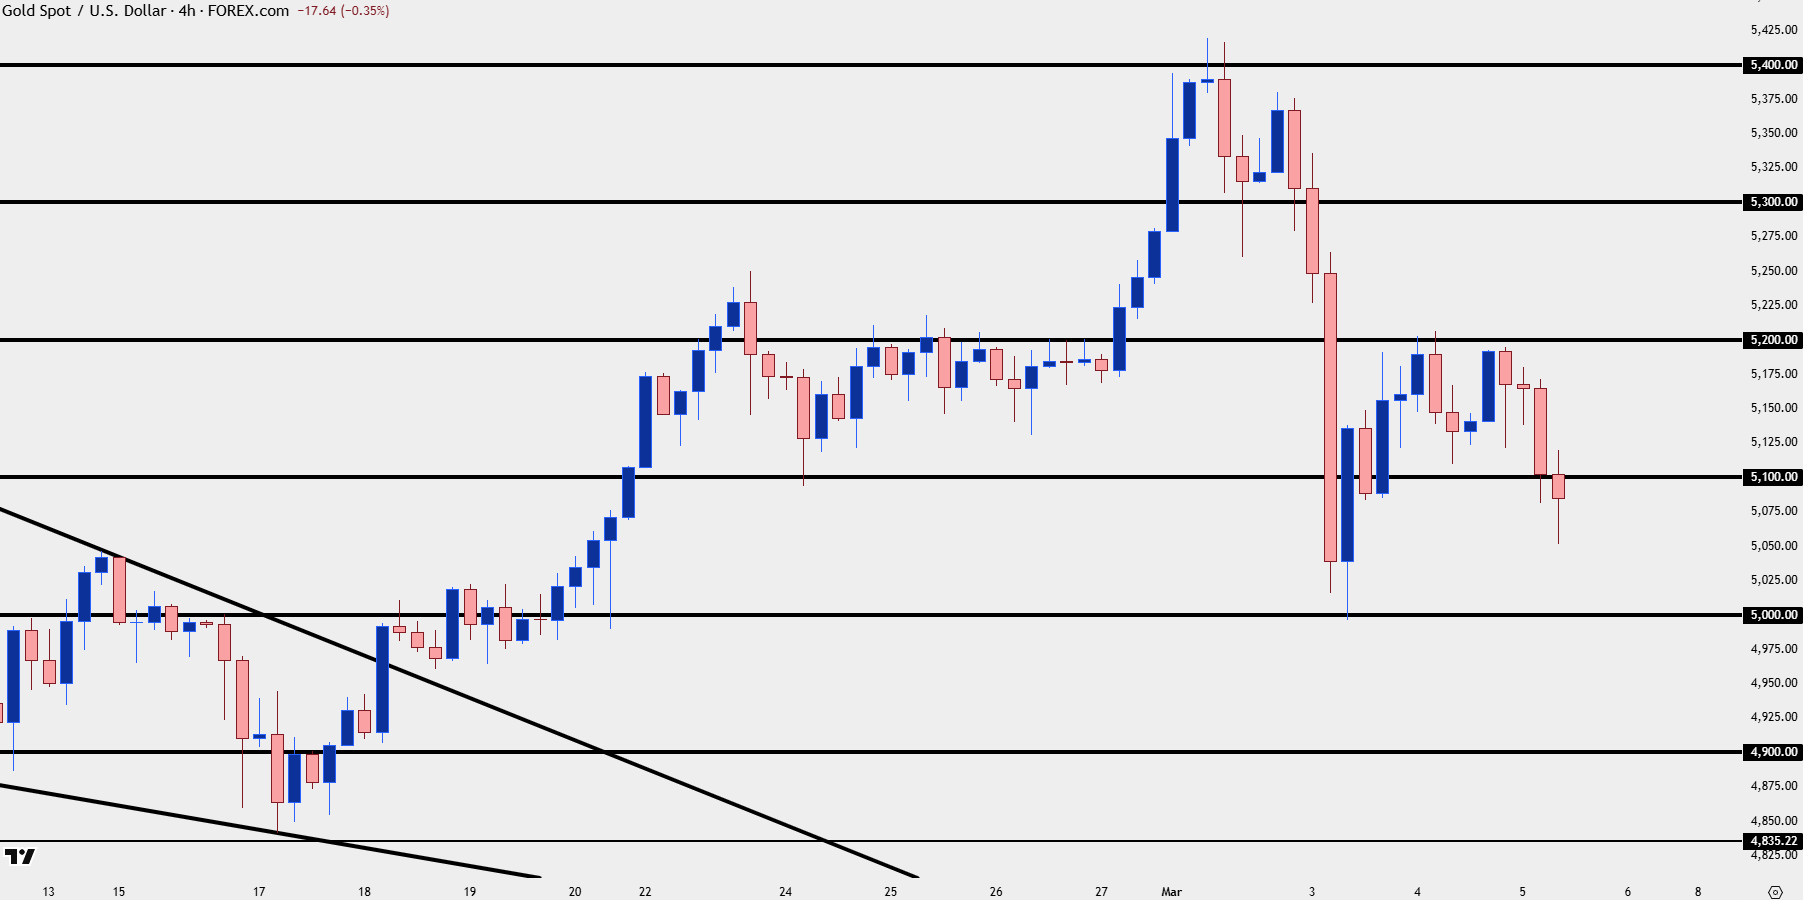
Chart prepared by James Stanley; data derived from Tradingview
Gold $5k
Major psychological levels can bring impact in a variety of ways and the two-year rally in gold highlights that well. While it took three and a half years for gold to finally leave the $2k level behind, both the $3k and $4k level stalled the trend before eventually serving as a launching pad for bulls, with a support test illustrated by an underside wick before buyers were ultimately able to drive into another massive rally.
So far – the $5k level has been a tough spot as seen from the wide upper wick in late-January followed by the continued grind around that price.
For this week, that level has so far set the low as it brought buyers back in on Tuesday morning, and if we can see that price hold into the end of the week, there could be something for bulls to work with.
But with that said it must also be pointed out that the current weekly bar which has a little over a day left until completion is showing as a bearish engulfing candlestick. These can be tough formations to fade, especially when counter-trend, as it illustrates the possibility of ‘something’ shifting, and given the dynamics in oil and equities after the heightened tensions in the Middle East, there’s a very relevant reason as to why we might be seeing that change.
So, it’s early – and if we do see a hold into the end of the week at $5k, there could be an opening door for bulls to take their shot. But this would need to be corroborated by follow-through if the weekly bar does in fact finish as a bearish engulf.
Gold Weekly Chart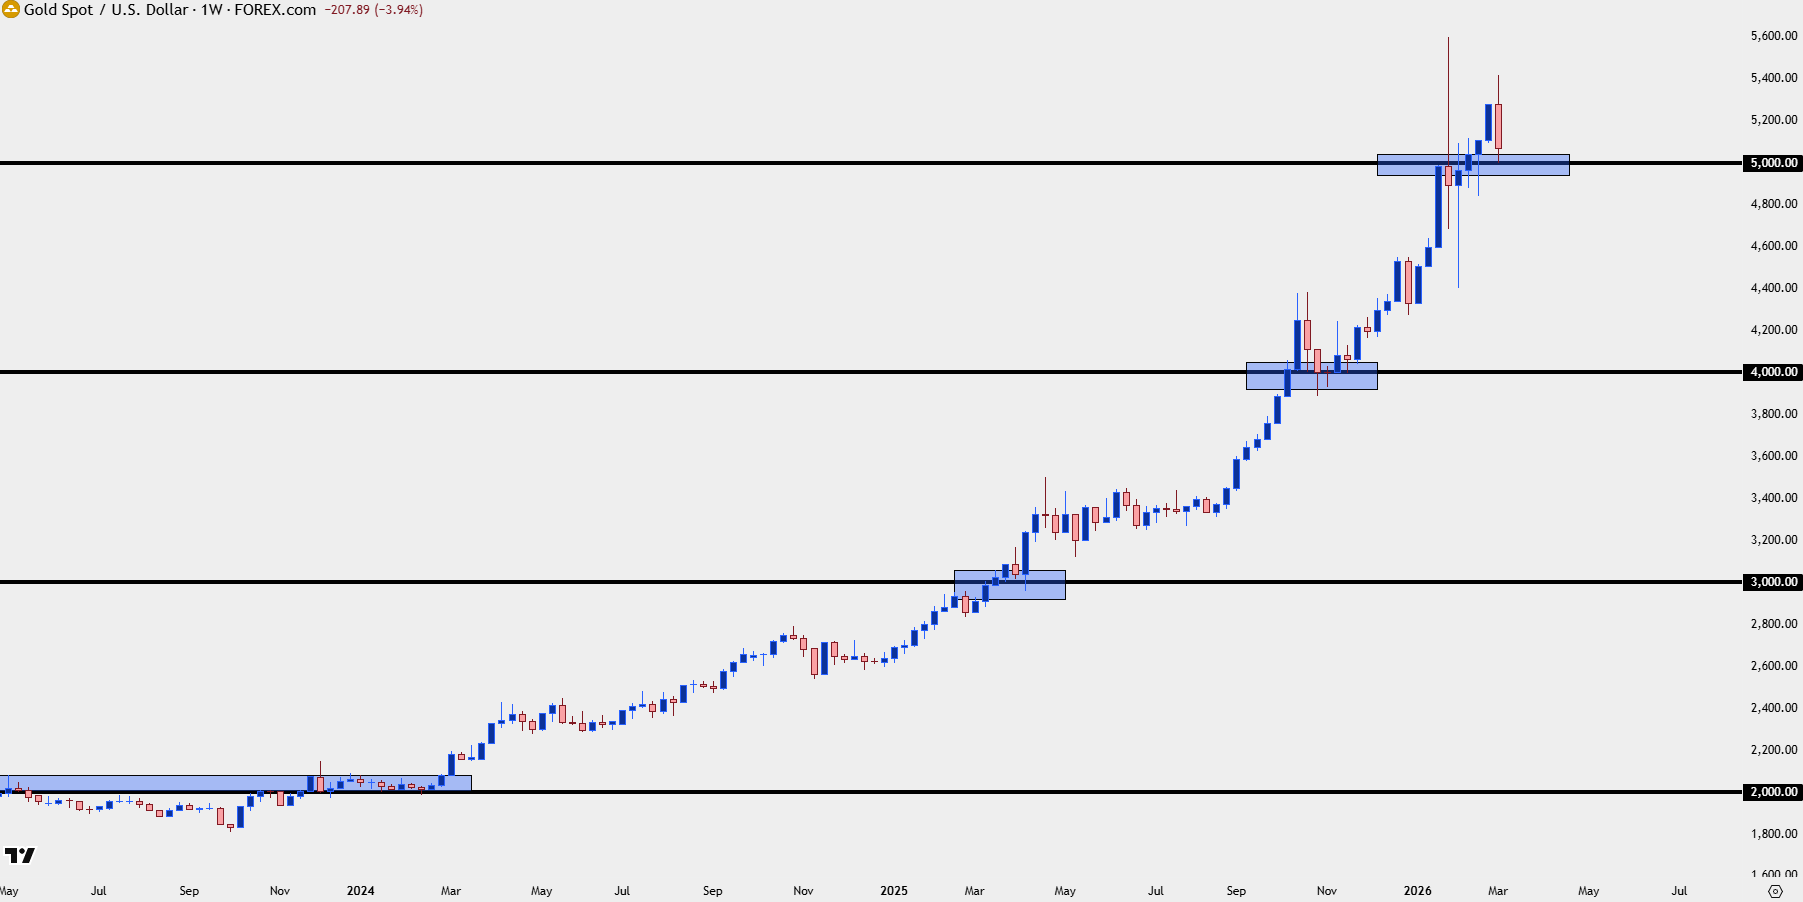
Chart prepared by James Stanley; data derived from Tradingview
Gold Shorter-Term Strategy
I’ve been tracking this in webinars for the past four weeks, looking at how a bullish bias could be integrated for short-term approaches on gold and as I’ve shown there, it’s been instances of underside wicks illustrating support, particularly around big levels, that has allowed for bullish continuation setups.
Most recently on Tuesday, I looked at the 5100 level coming into play as short-term support, and that allowed for a rally and re-test of 5191-5200. Bulls put in a couple of tests at that zone but ultimately failed, and that’s allowed for another deeper pullback.
But as of this writing there’s been four hours of support around the 5060 level, so it’s still early but this could set the stage for a rally if buyers can punch back above the 5091-5111 zone. Until then, this is a short-term lower-low and that zone represents a possible area for a lower-high. If sellers can extend the move, the focus is on that 5k level into the end of the week and the question there is whether bulls show up to hold price above the Tuesday swing low.
On the long side of the matter, if buyers can force a test above the 5111 zone, then it’s the 5191-5200 that’s the obvious spot for the next major test, after which the familiar area of 5238-5270 comes back into the picture.
Gold Hourly Price Chart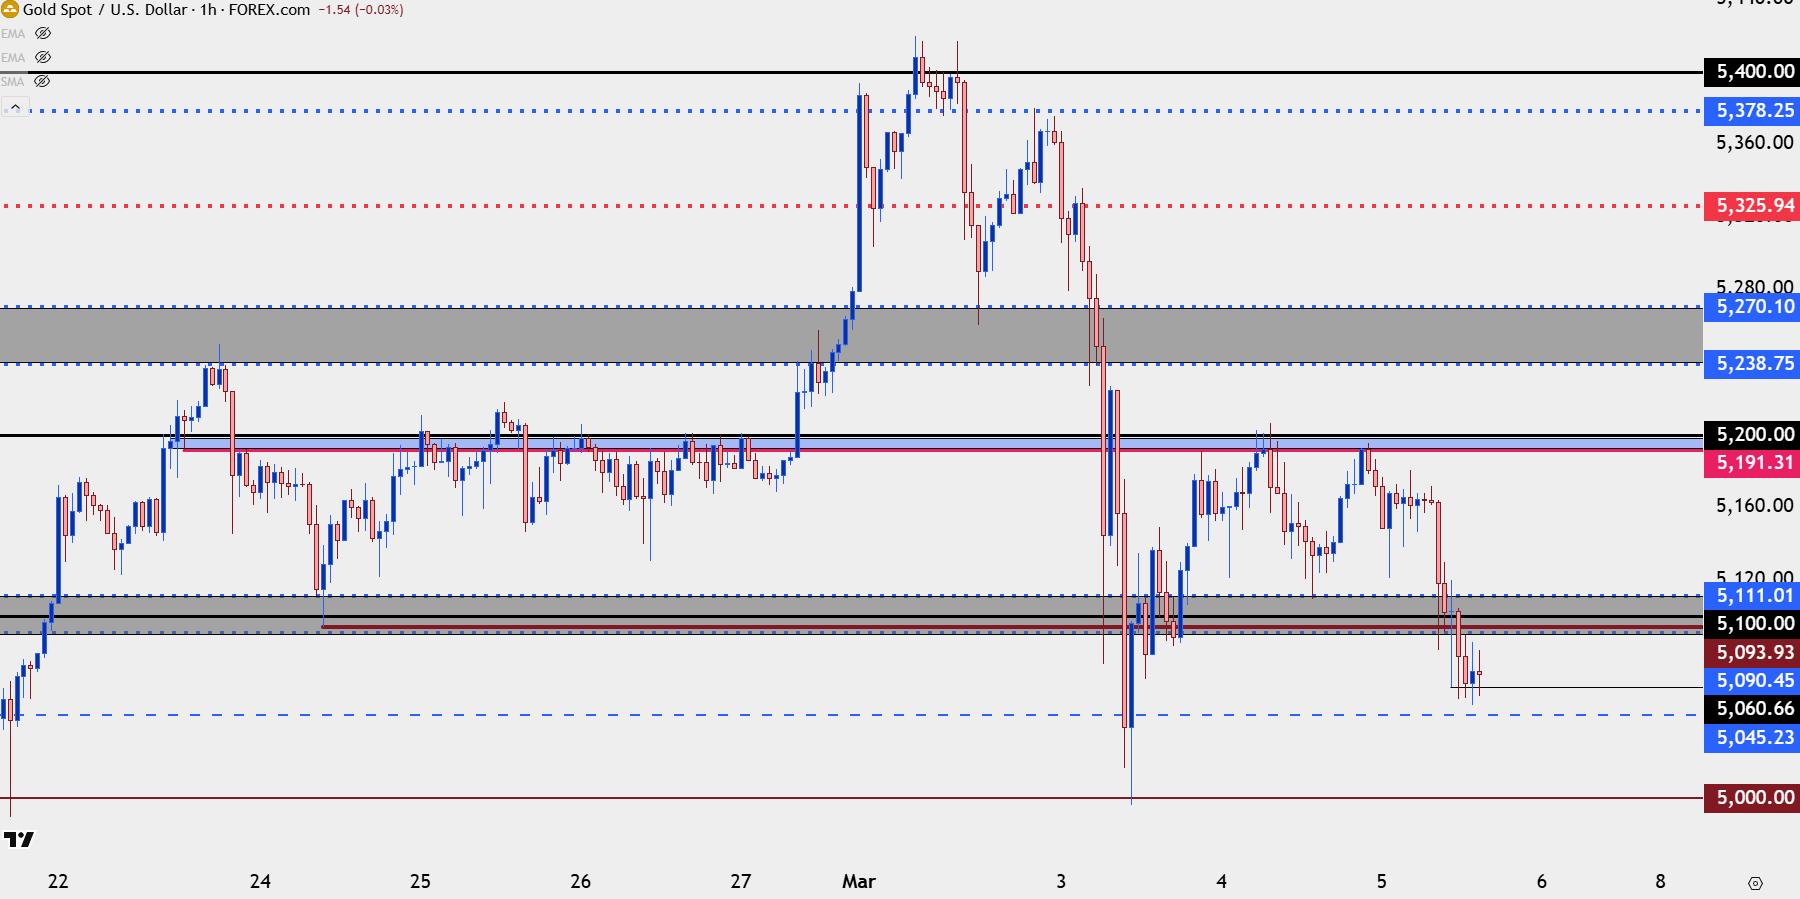
Chart prepared by James Stanley; data derived from Tradingview
--- written by James Stanley, Senior Market Analyst, Global Macro