Gold Talking Points:
- Gold had gotten to extreme overbought levels last week on a variety of timelines and the snapback move last Friday kept through the weekly open.
- Bulls responded in a big way with support at $4500 and then higher-low support at $4600. Since then, there’s been a tendency for swings to adhere to major psychological levels and that helps to define structure as we move into Friday trade.
- From shorter-term charts there’s a descending triangle with support at $4800 which can be negated by a break of $4941.

Gold pushed a historic run through last week’s trade and the metal finally found sellers right at the $5600 psychological level.
That led to a dip down to $5100 as buyers returned for a perceived value, but the bounce was short-lived, and longs that had ridden the wave-higher used it to take profits before the $5500 level could come back into play. That led to a brutal Friday as gold posted a historic loss with prices dipping all the way down to the $4700 level before a bounce showed into the weekly close.
The pain continued through the Sunday open, and gold again slid aggressively as profit taking from buyers dominated the flow, leading to a test below the $4500 level.
Since then, however, bulls have been making a mark and there was a series of higher-highs and lows that built from that splashdown open on Sunday night. Yesterday saw prices cross back above the major psychological level of $5k, and this is where buyers began to stumble, and at this point, there’s now a bearish short-term formation in the shape of a descending triangle.
Gold Hourly Chart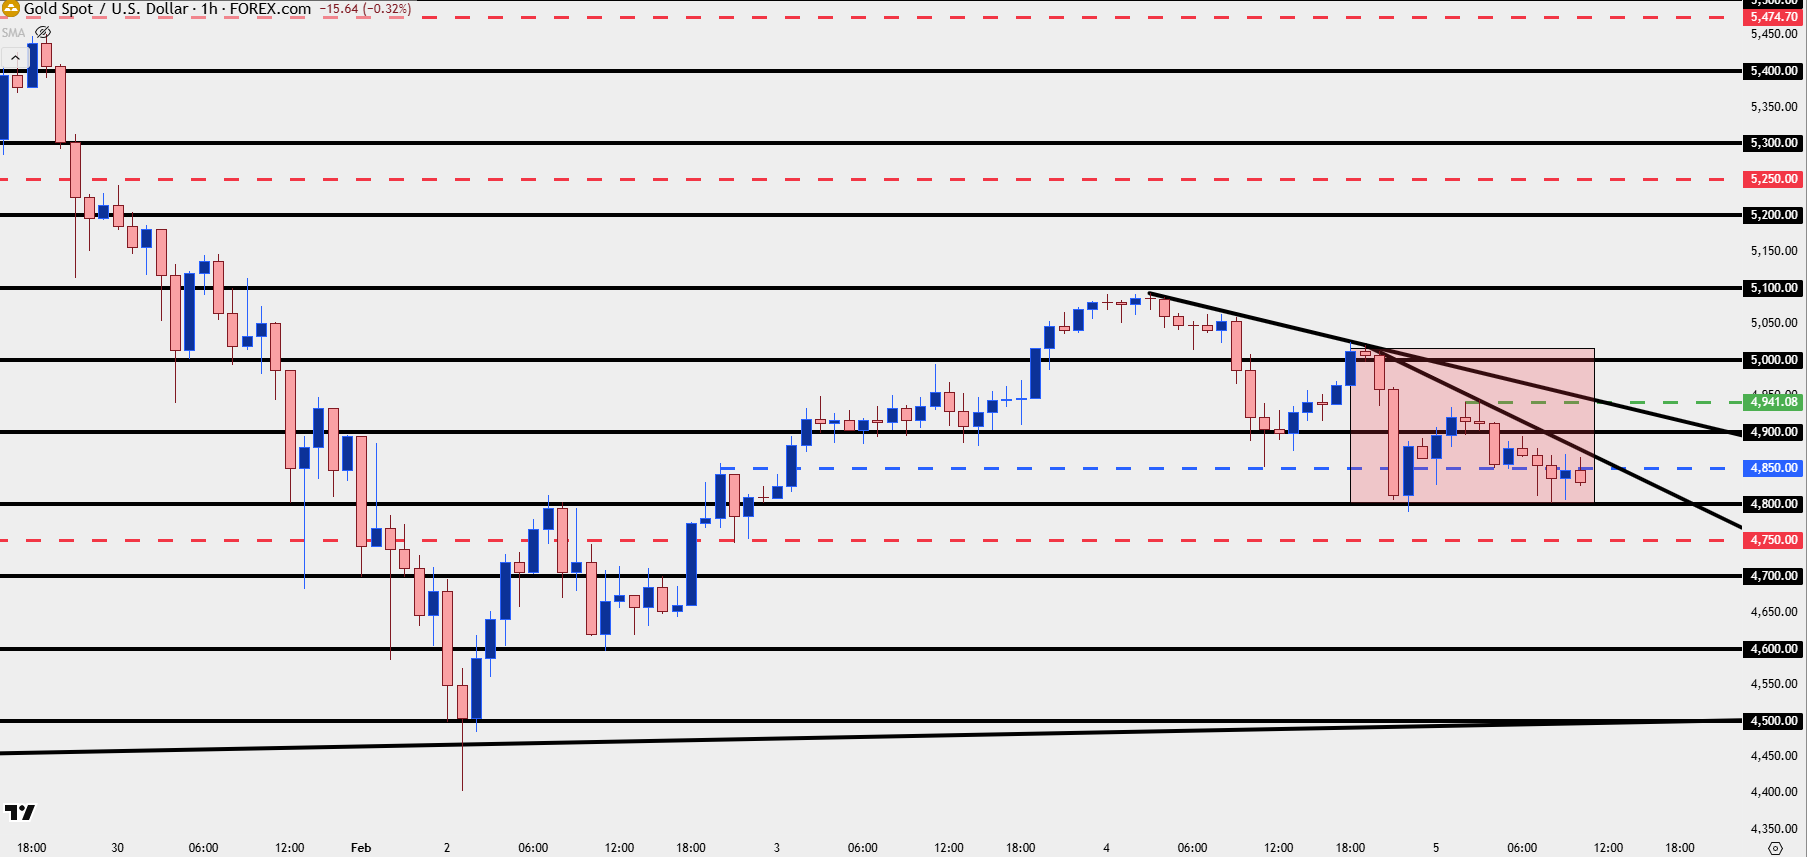
Chart prepared by James Stanley; data derived from Tradingview
Gold Scenario Plotting
At this point there can be an argument on either side of gold, as the shorter-term bearish formation above runs counter to the aggressive bullish trend that drove into last week. To be sure, this can justify a larger pullback in that broader bullish trend but the reality is many of the same reasons that drove the trend-higher into last week remain true today.
If we do want to pick on fundamentals perhaps the item that does stand out was the defense of the US Dollar from both US Treasury Secretary Scott Bessent and Director of the National Economic Council, Kevin Hassett. Strength in the US Dollar and weakness in gold seemed to track those comments from last week and justifiably seeing US officials talk up the benefits of a strong Dollar can be reason for that runaway trend in gold to at least take a pause on the basis of profit taking.
The bigger question is whether it will compel even more profit taking to show or whether buyers will use this pullback as opportunity to add more exposure. Because, after all, it was just a little over a week ago that buyers were hitting the bid aggressively at $5300 or $5400 and now, a week later, they have opportunity to pick up gold at below $5k an ounce. So, a valid case on either side, in my opinion.
For forming strategy, however, that kind of fundamental hedging does little to help; and instead, this is where technicals and structure can come into play. At this point gold as largely adhered to psychological levels and currently it’s the $4800 level that’s setting support for the descending triangle looked at above. Previously, the $4900 level set support ahead of the $5k re-test, and it was above that major psychological level that buyers ultimately faltered.
So, at this point, I want to stick with the structure that’s held so far and this puts focus on the $4600 and $4500 levels that were in-play earlier this week for downside scenarios. The $4700 level would also be of interest, as a drop down to that price followed by a return of buyers could justify a higher-low above the previous higher-low structure from earlier in the week. For topside setups, a break of $4941 will negate the descending triangle and that points to re-test of the $5k level, after which $5100 becomes the next big spot – and a break of that amounts to a short-term higher-high which would further open the door for bulls to make a mark.
Gold Four-Hour Price Chart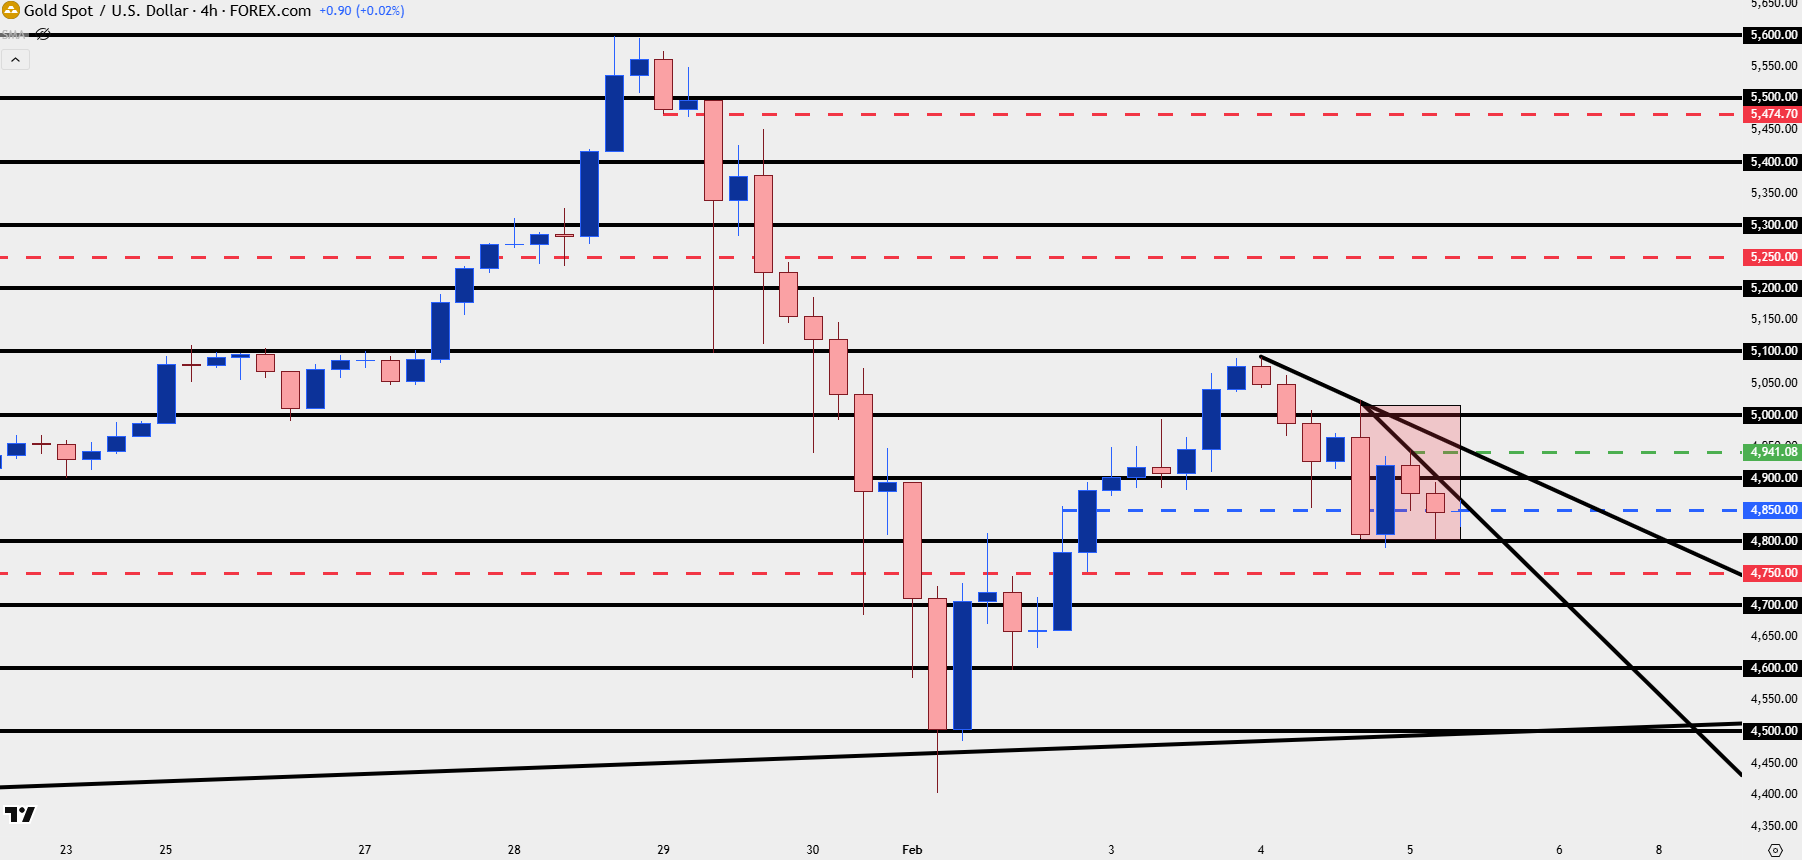
Chart prepared by James Stanley; data derived from Tradingview
--- written by James Stanley, Senior Market Analyst, Global Macro