
Yen-weakness has continued, and USD/JPY has stepped up for a test of its eight-month high ahead of rate decision from the Fed and BoJ. The matched highs will often get talked about as a double top but the reality is that formation does come to life until there’s a breach of the neckline, or the low between those two highs, and at this stage, the market still carries a bullish feel to it. Yen-weakness has been more attractive in EUR/JPY, however, as I’ve looked at over the past few weeks and that’s led to a fresh all-time-high in the pair. GBP/JPY has lagged of late but there’s a similar bullish backdrop there, although bulls’ stalling has allowed for the build of a bearish short-term formation, as looked at in the video.
USD/JPY
USD/JPY has stepped up for a test of its eight-month high and the FOMC and BoJ rate decisions later this week can keep the pair on the move.
Given the matched highs, the common observation is double top potential, like what’s played out in gold over the past week as the metal has finally found a retracement following two months of parabolic-like gains. But for that to come to fruition, there needs to be a break of the neckline and in USD/JPY, that’s all the way down at 149.38. In a week with both FOMC and BoJ, a move of that nature is possible, but I’m not considering it as a base case at this point.
Instead, I’m tracking support at the 2022 and 2023 high of 151.95 up to 152.18, with the Fibonacci level of 151.51 below that. And as an ‘s3’ zone, I would want to see buyers step in to defend above the 150.00 handle, with the zone plotted from 150.51-150.90.

USD/JPY Four-Hour Chart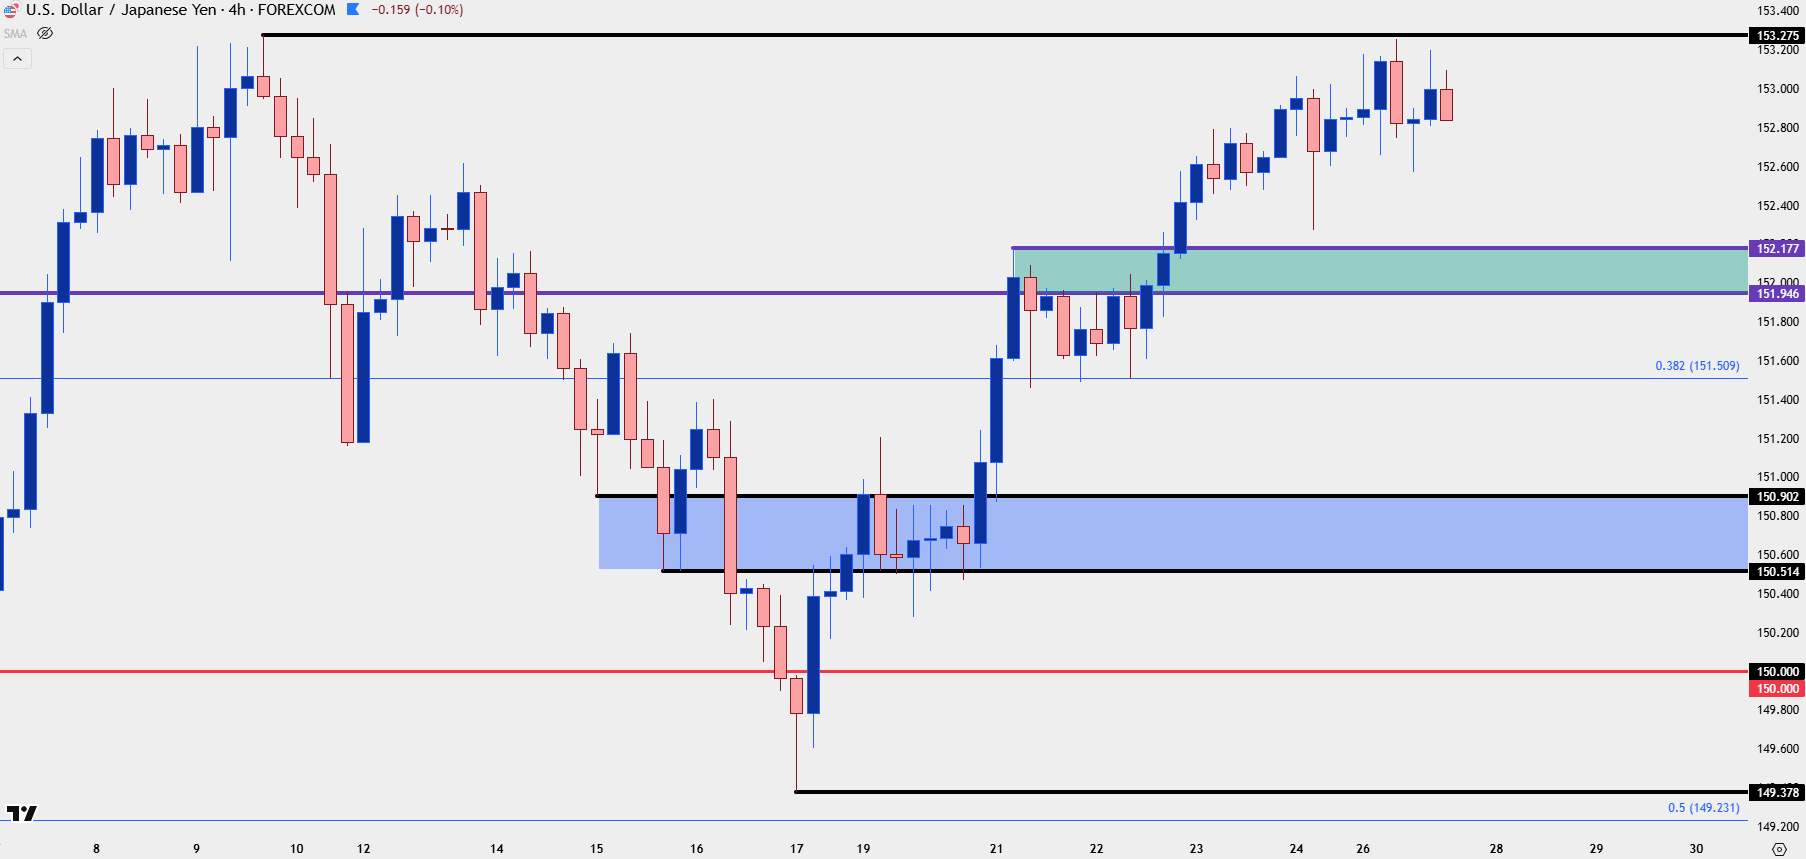
Chart prepared by James Stanley; data derived from Tradingview
EUR/JPY
EUR/JPY has been the pair that I’ve been focusing on for Yen-weakness a bit more than USD/JPY and even GBP/JPY of late, but now the pair is trading at a fresh all-time-high and showing signs of stall at the 100% measured move of the July pullback. This isn’t something that I would necessarily want to get bearish on, but prior resistance at 176.25-176.48 is quite far away, so ideally bulls would step in for support around the 177 handle to open the door for another test of resistance at recent highs.
EUR/JPY Four-Hour Chart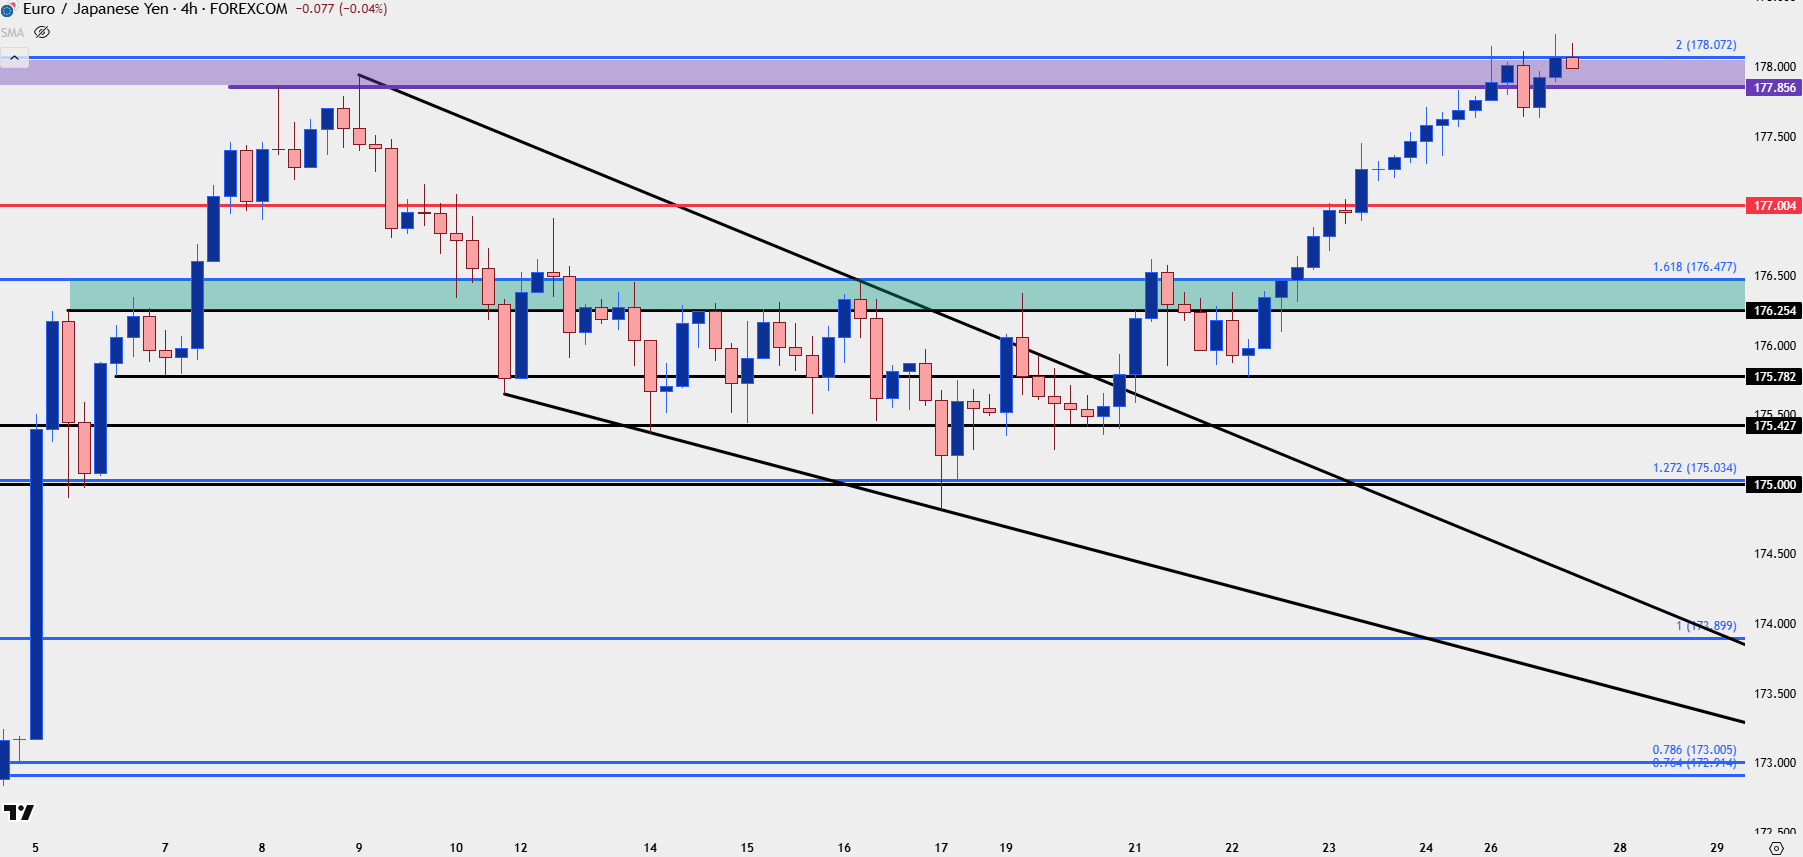
Chart prepared by James Stanley; data derived from Tradingview
GBP/JPY
While EUR/JPY had built into a falling wedge before the bullish reversal last week, GBP/JPY has set up in a short-term rising wedge which is often approached with aim of bearish reversal. Like I said in the video, I’d instead look to see if that can create a pullback to support and already, from the hourly chart, that test has showed up. A bit lower is the prior swing low at 203.58, but it’s the 203.06-203.31 zone that sticks out as a key spot for bulls to defend if they are going to retain control of the trend.
GBP/JPY Hourly Chart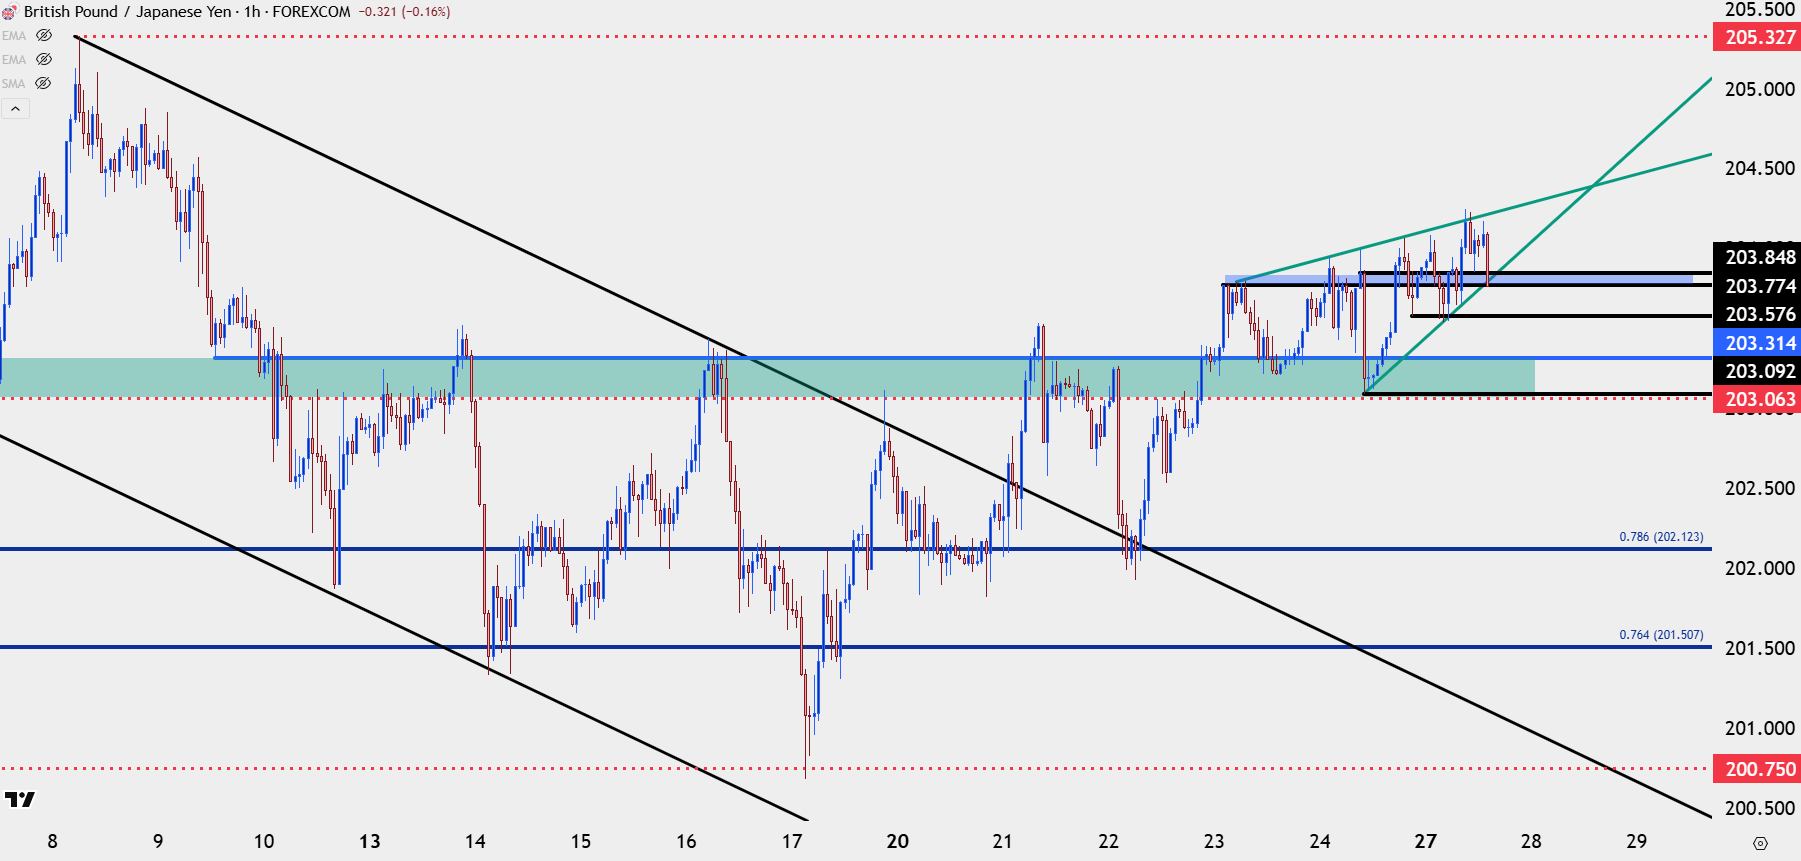
Chart prepared by James Stanley; data derived from Tradingview
--- written by James Stanley, Senior Strategist