WTI Crude Oil Key Points
- The closure of the Strait of Hormuz has shifted the market toward expecting fundamentally higher oil prices and weighed on indices.
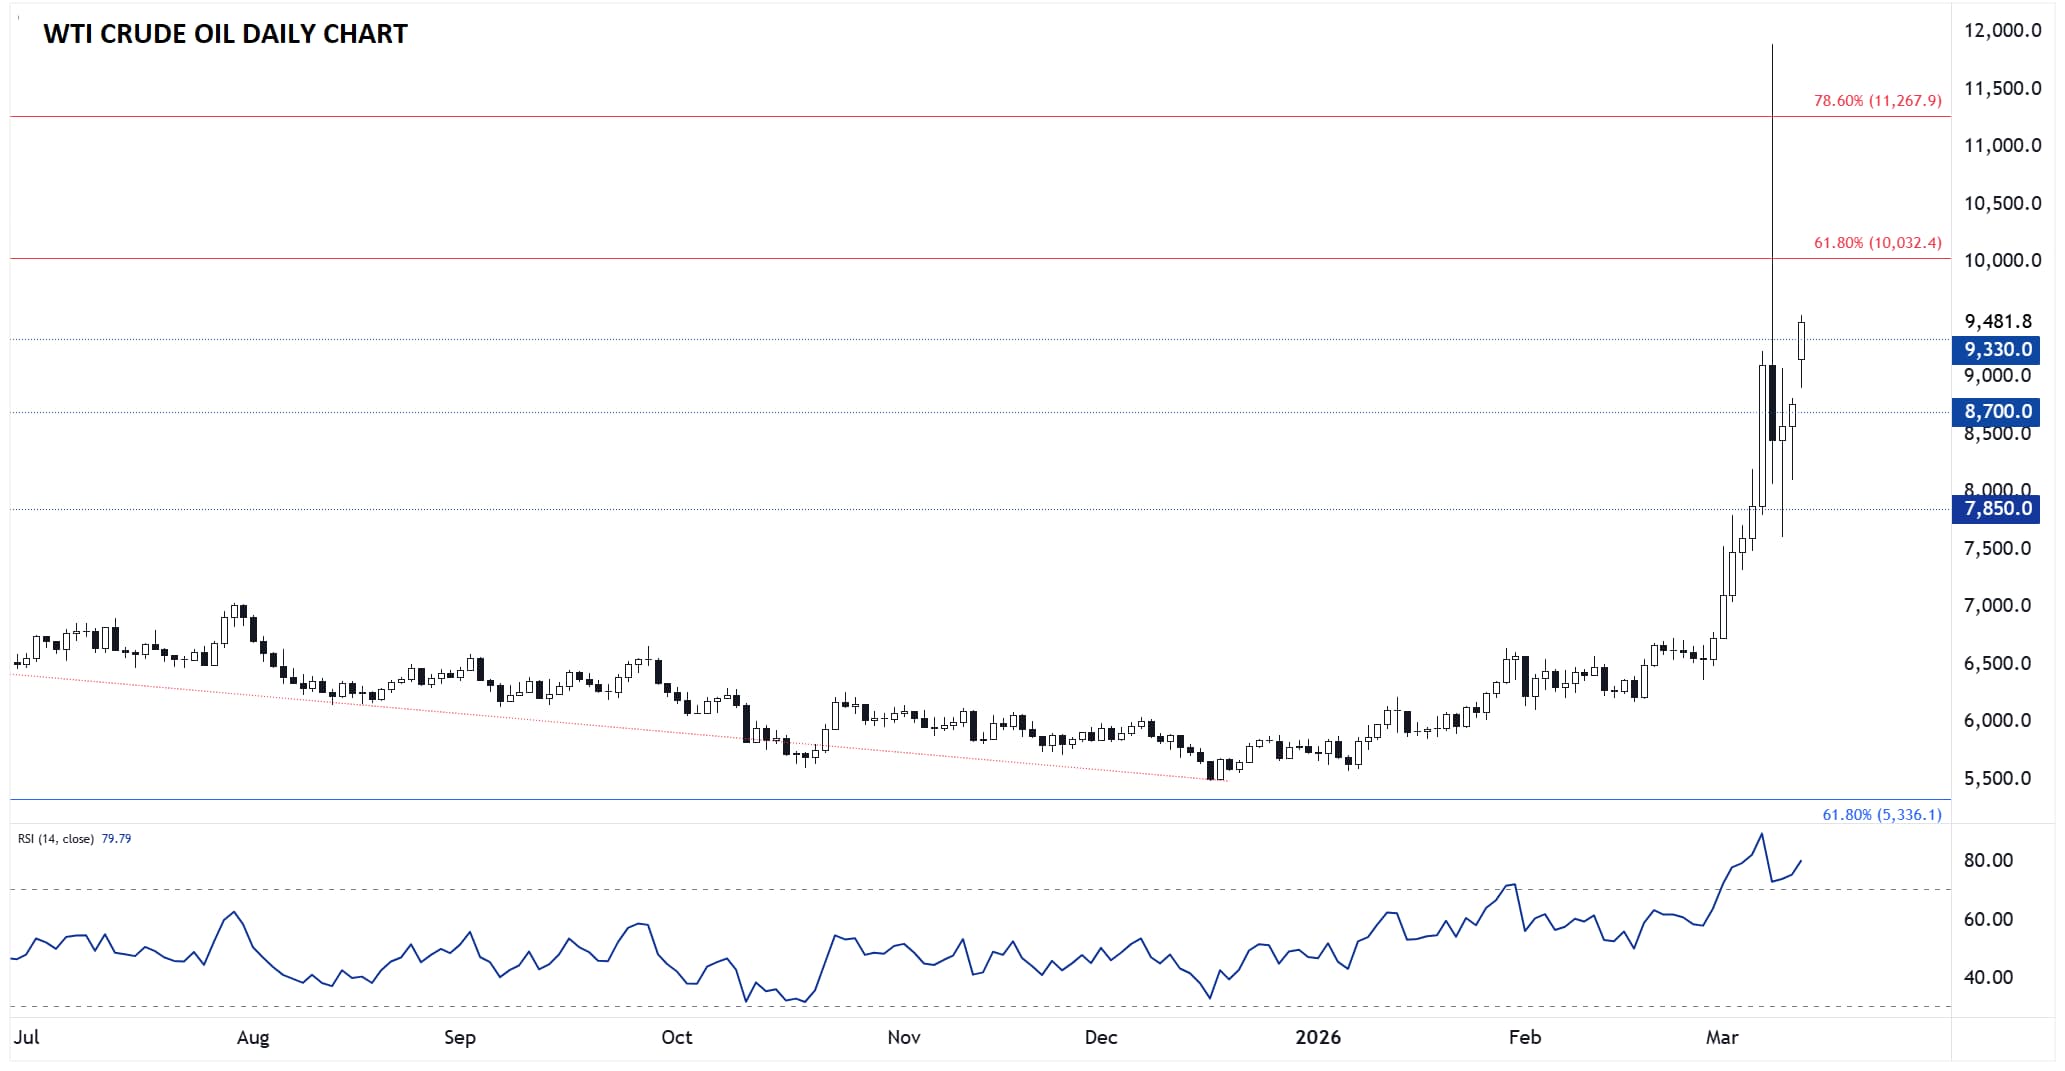
- WTI crude oil prices are on track for their highest close in 3.5 years, bringing the psychologically-significant $100 level into sight next.
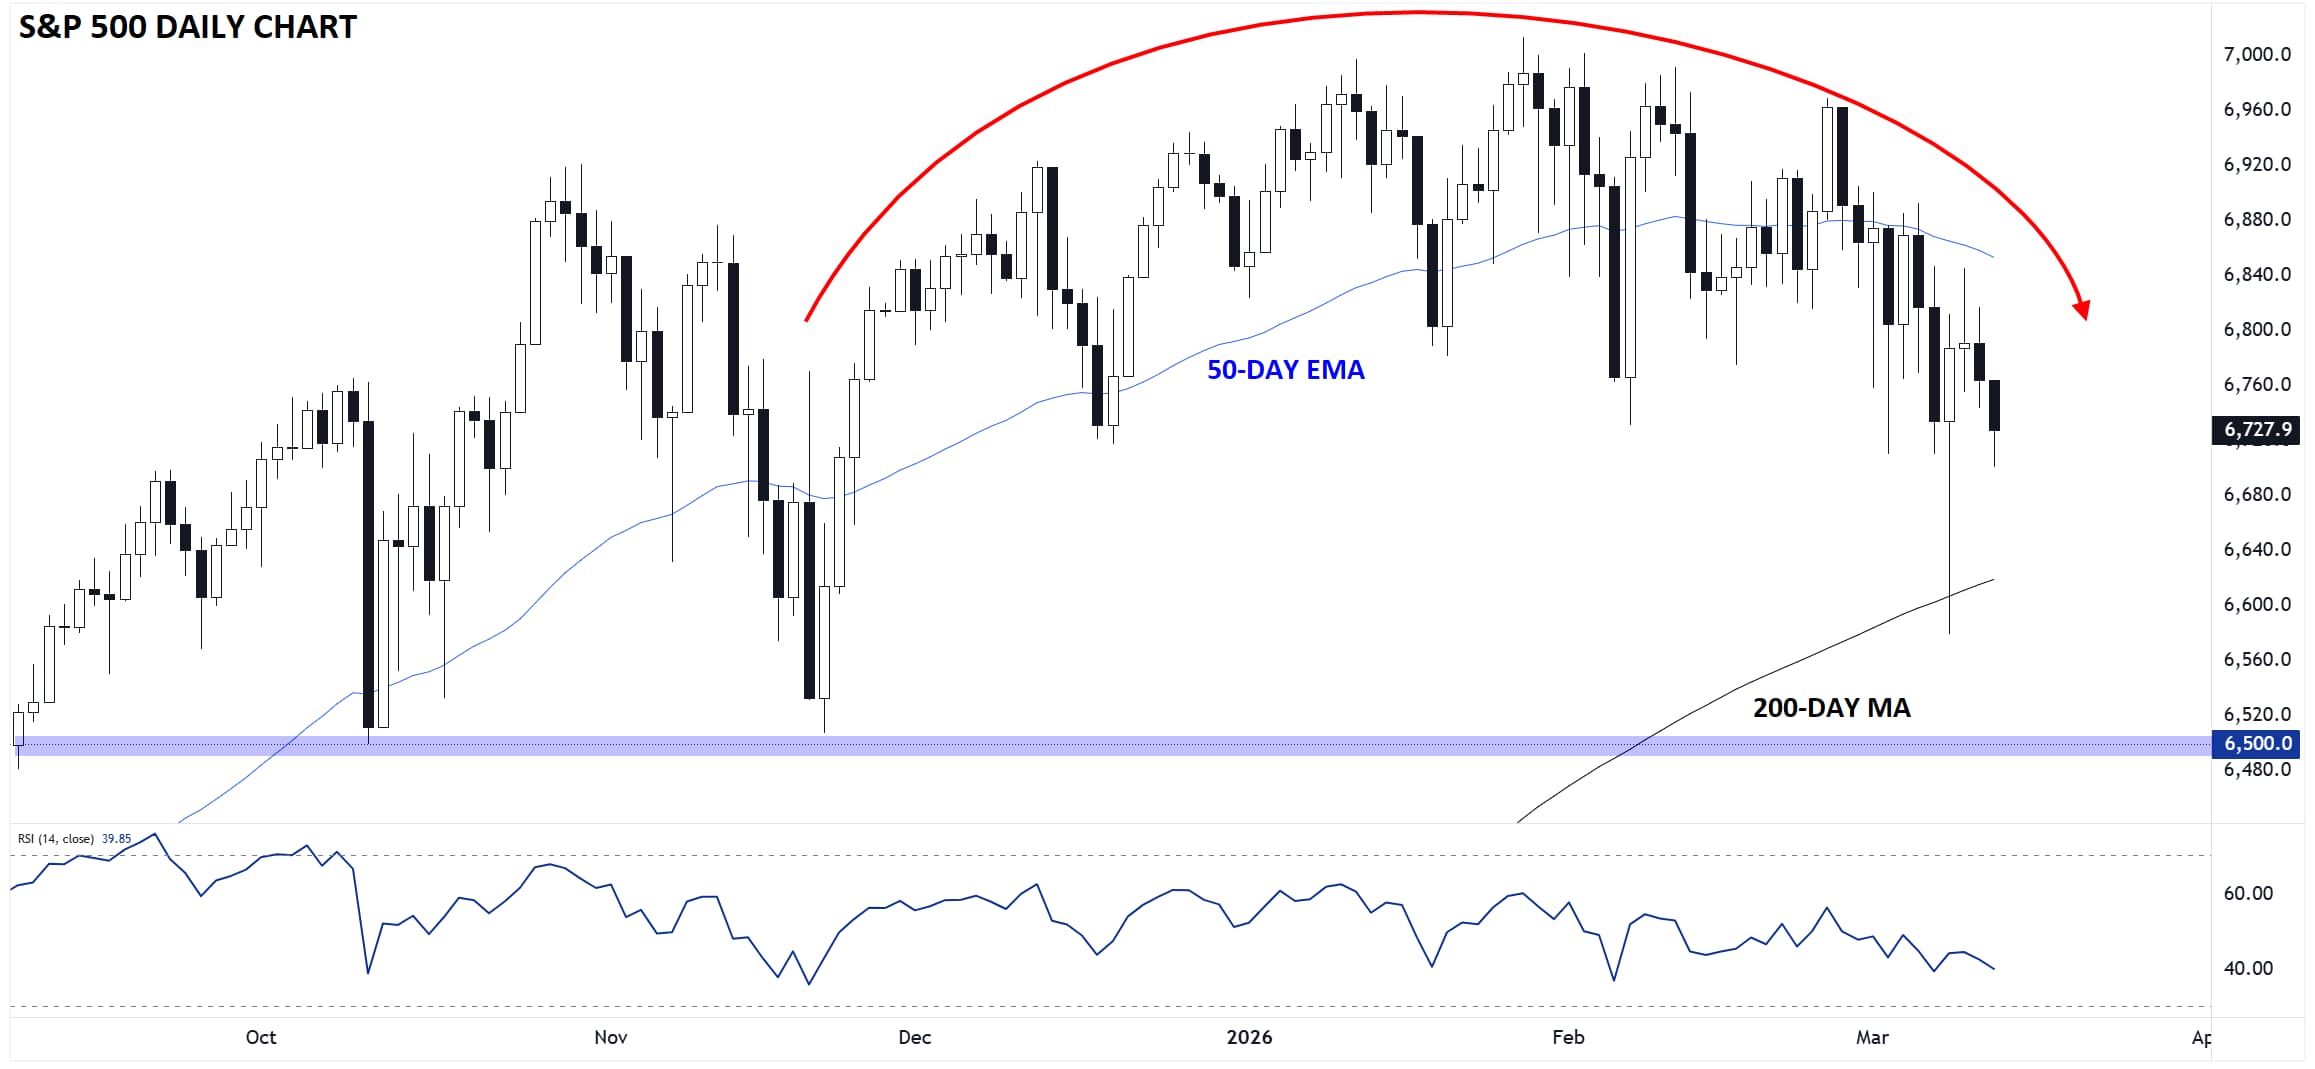
- The S&P 500 is gradually but clearly rolling over, bringing support from the 200-day MA near 6,620 into sight
Anecdotally, it feels like markets are settling into a “new normal” as the war in Iran stretches toward two weeks. Every morning, traders wake up to now-familiar news of more bombings in Tehran, counter-attacks from Iran against its neighbors, and essentially non-existent crossings in the Strait of Hormuz.
At the risk of being dramatic, these developments have marked a “shift in the market winds”: following years of generally strong equity markets, subdued energy prices, and broadly low interest rates, those trends have reversed, and the default assumption as long as the Strait of Hormuz remains functionally closed is that stocks will be under pressure, oil prices will trend higher, and interest rates will tick up in unison.
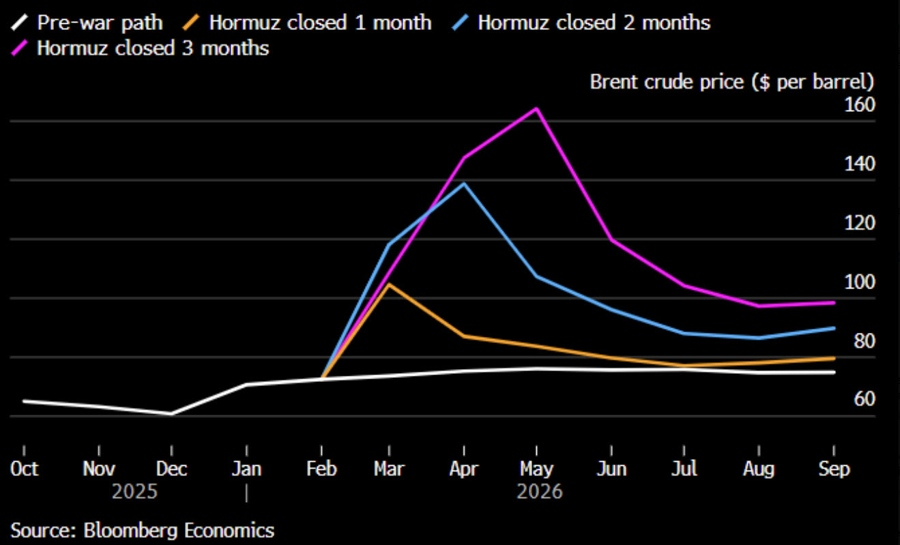
Earlier today, the International Energy Agency noted that the current Middle East conflict is creating "the largest supply disruption in the history of the global oil market" and that it will take "weeks and in some cases months for upstream production to return to pre-crisis levels." According to Bloomberg Economics, the oil market will only become more and more unbalanced the longer the current situation holds, with a 3-month disruption potentially sending oil prices to above $160/barrel:
As William Arthur Ward once quipped, “the pessimist complains about the wind; the optimist expects it to change; the realist adjusts the sails.”
Unless or until we see meaningful progress toward a ceasefire in the Middle East, traders should shift their expectations that the coming weeks and months will look different than the past couple of years, weighing on risk appetite at an accelerating rate.
Crude Oil Technical Analysis: WTI Daily Chart
Source: Tradingview, StoneX
Turning our attention the charts, WTI crude oil prices are edging toward $95 as we go to press, on track for their highest close in over 3.5 years. As noted above, traders have now shifted toward buying short-term dips as long as the Strait of Hormuz remains closed, and the path of least resistance remains to the topside. A confirmed closed above $93.30 opens the door for a retest of the long-term 61.8% Fibonacci retracement around the psychologically-significant $100 level, followed by the 78.6% level above $112.

S&P 500 Technical Analysis: SPX Daily Chart
Source: Tradingview, StoneX
With rising oil prices weighing on earnings and the broader economy, the S&P 500 is gradually but clearly rolling over. The index is carving out a broad “rounded top” formation over the last three months, bringing support from the 200-day MA near 6,620 into sight. Below that level, bears will target the 6-month low near 6,500 next.
-- Written by Matt Weller, Global Head of Research
Check out Matt’s Daily Market Update videos on YouTube and be sure to follow Matt on Twitter: @MWellerFX