S&P 500, SPX Talking Points:
- U.S. equities continue to rally with SPX starting the week with yet another gap. While the trend has been clear such scenarios can be surprisingly difficult to trade from a risk management perspective given the seeming lack of two-way price action.
- Last year when the Fed cut rates as widely expected SPX finished the day in the red, with a gap the following morning with support holding at a key spot on the chart. With a series of rate cuts widely priced-in could there be similar pullback potential into this meeting?
- I’ve been bullish on equities for some time now in our forecasts and Q3 is no different, click below to access the full guide.

John Templeton said “the time of maximum pessimism is the best time to buy, and the time of maximum optimism is the best time to sell.”
I’ve used that quote in webinars a few times over the past couple of years and it does present a bit of a paradox, as ‘maximum pessimism’ is only usually going to be apparent with hindsight. Like a market going overbought, pessimism can seemingly continue to get more and more pessimistic; but this doesn’t necessarily refute Mr. Templeton’s take towards the value of contrarianism.
Right now is an excellent example, as markets are and have been quite optimistic for some time now. This is stark contrast to the brutal pessimism that we saw back in April, when both fiscal and monetary policy were at odds with bulls. The monetary policy that had been at least somewhat supportive for much of the prior 16 years was notably missing as the Fed was cautious of inflation potential from tariffs. And fiscal policy felt a fear, as well, as tariffs threatened to upend a frothy AI-driven equity market that had been driving since even before the Fed started cutting rates the year before.
That pessimism showed quickly, and it didn’t take long for many market participants to start looking frantic, as we saw from one noted talking head warning of a ‘Black Monday’ like event. Ironically, that Monday ended up being the low. I wrote an article on that morning, noting the pessimistic backdrop at the time along with the fact that a fiscal turn could be nearby as President Trump had some degree of control on the matter. That morning we heard a rumor float that tariffs would be delayed and that led to a rip, even with the report later being walked back.
That Wednesday, however, saw the announcement in a formal fashion and stocks responded with one of their largest single-day gains in history. And just like that, it became apparent that maximum pessimism had already shown.
In the five months since equities have continued to rip to fresh all-time-highs, with yet another printing this morning. And along the way, the monetary side of the matter joined in on the rally as the Fed started shifting, slowly but surely, into a more dovish direction. And even though inflation remains high today, the Fed is nearing a widely-expected rate cut on Wednesday, which is expected to be the first of many.
While the trend has been clear for much of the rally, these can be surprisingly difficult backdrops to work with, especially for experienced traders. A lack of two-way price action with a rally just continuing to stretch doesn’t offer much opportunity for buying pullbacks except to traders with extreme patience; and even then the open door may be missed.
As we approach the widely-expected start of a rate cutting cycle, there is some possible opportunity on that front. If we hear a Fed that isn’t quite as dovish as what markets expect, that could bring rationale for a pullback. Or perhaps the start of rate cuts shows as a ‘buy the rumor, sell the news’ type of event. After all, last year when the Fed started cutting rates SPX pulled back that day, right around the 5638 Fibonacci extension. They did gap up the following day, and the prior point of resistance at 5670 then became support in early-October as equities rallied into the election. But – that illustrates well the value of anticipation, and the fact that trading near-parabolic-like trends isn’t necessarily a simple task.
But for the trader that’s patient and prioritizing risk management, there may be opportunity given the stimuli. On a longer-term look of SPX, there’s been a minimum of pullback of late as price has spent much of the past few months in an aggressively-sloped channel. The index is currently chewing through 6600, but the 6500 level was prior resistance that hasn’t yet been tested as support. A pullback and show of buyer response there would open the door for trend continuation and that would be a mild pullback given the bigger picture. Below, I’ll go down to a shorter time frame to open up the option set.
SPX Daily Chart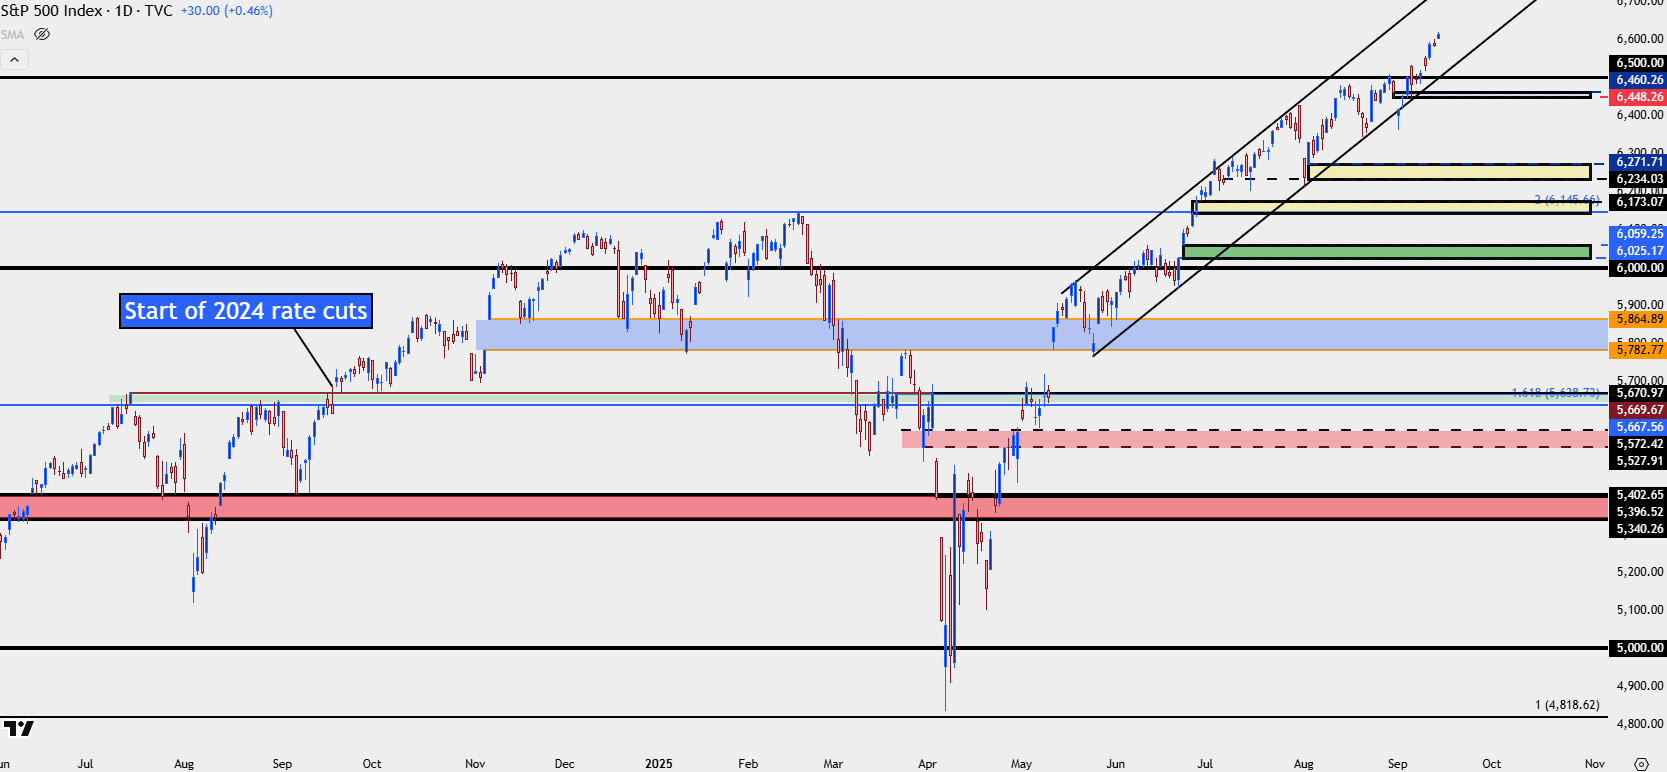
Chart prepared by James Stanley; data derived from Tradingview
SPX Shorter-Term
The way that a market treats gaps can offer quite a bit of information. If we have a market that’s gapping up and not even bothering to fill the prior gaps, that illustrates a one-sided drive of almost frantic fear of missing out, which is largely what we’ve seen since SPX left 6500 behind. This can make chasing in this area, without a pullback to that level, as a daunting prospect. There was a prior gap around 6450 that was filled with a pullback, and for shorter-term traders looking for a higher-low to work off of, that can illustrate a possible way forward.
And that can happen on larger scales, as well, particularly if we do get a larger ‘buy the rumor, sell the news’ event around this week’s rate cut, which would likely have to be driven by the Fed’s dot plot matrix.
The zone that I think is most interesting for bigger picture pullback scenarios is down around 6145-6173. This is the 100% measured move of the 2022 pullback at 6145 and this is the price that marked the high in February before the turn. If we do see price down there, expect to see or hear that pessimism angle show up. And that may be one of the more opportune times to investigate trend continuation potential.
SPX Four-Hour Price Chart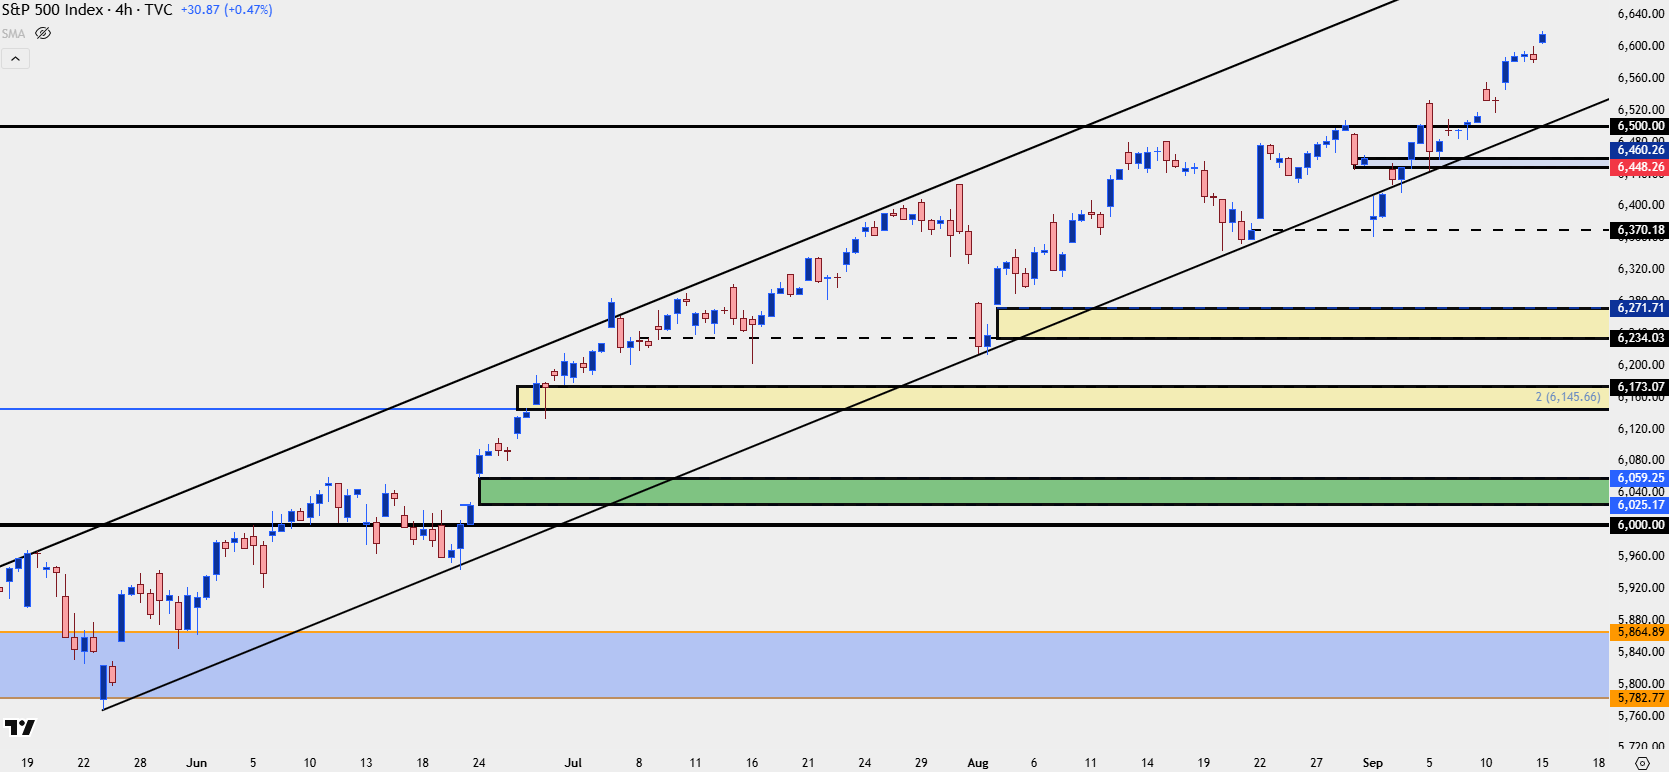
Chart prepared by James Stanley; data derived from Tradingview
--- written by James Stanley, Senior Strategist