
Though we have seen some weakness in US stock markets recently, this has been nothing compared to the percentage drops we have seen this year for Bitcoin, silver and several major Asia pacific equity markets. The divergence raises an important question: is S&P 500 genuinely insulated from the forces weighing on other assets, or is it simply taking longer for the weakness to spread.
Why have US markets held up relatively well so far?
So, why US markets haven’t a taken a big hit so far this year, compared to for example the 2022 bear market when stocks, gold and bitcoin all fell unison? Well, there are some key differences. But that doesn’t mean the S&P 500 can’t fall from here. With valuations elevated and concerns surrounding AI investment, inflation and monetary policy at the forefront, the risks of another bout of selling should not be dismissed.
Why 2026 is different from the 2022 bear market
The last time US stocks, gold and cryptocurrencies experienced simultaneous bear markets was in 2022. The S&P 500 fell approximately 25% from its January peak to its October low, Bitcoin lost more than 75% from its late-2021 high, while gold suffered a drawdown of around 20% from its March 2022 peak.
The common denominator was an aggressive tightening cycle by the Federal Reserve. Faced with multi-decade-high inflation, the Fed raised interest rates rapidly from near-zero levels, pushing real yields higher, strengthening the dollar and draining liquidity from financial markets. Few major asset classes were left untouched.
The current environment has some similarities, particularly with inflation remaining a concern and the dollar providing a headwind for internationally traded assets. But the underlying dynamics are rather different.
For one, the US economy has proved relatively resilient, while corporate earnings and investment spending, particularly across the technology sector, have continued to provide support. The AI investment cycle remains a powerful driver of market sentiment, with substantial spending by hyperscalers helping to underpin expectations for future earnings growth.
This has also helped explain why the S&P 500 has been more resilient than several Asian markets. China’s equity weakness reflects a combination of disappointing domestic demand, concerns over profitability and an unwinding of elevated technology valuations. South Korea and Japan, meanwhile, have greater exposure to the semiconductor and hardware supply chains, leaving their markets particularly vulnerable to concerns about AI spending and regulation.
Europe has also held up relatively well, helped by its different sector composition, infrastructure and defence spending, and more attractive valuations in parts of the market.
The weakness in Bitcoin and gold has also had its own drivers. Bitcoin’s decline looks partially more like a cyclical correction within the cryptocurrency market, while gold is giving back some of its substantial earlier gains, although high yields, strong dollar and expectations of further Fed tightening are clearly other headwinds.
Could the S&P 500 finally succumb to selling pressure?
That does not mean Wall Street can remain immune indefinitely. The S&P 500 was still up around 10–11% for the year at the time of writing, despite retreating from its October highs. Its ability to recover from the sharp early-November sell-off suggests investors remain willing to buy weakness. However, the recent volatility has exposed some vulnerabilities beneath the surface. We have seen markets give back so of those gains and markets are starting to look heavy.
AI is arguably the biggest concern. The investment cycle has supported equity valuations, but questions are increasingly being asked about the returns on the enormous sums being committed to data centres, computing infrastructure and related technologies. Nvidia’s results might shed some light into this.
Concerns over tighter regulatory oversight following the US midterm elections have added to the uncertainty. Any further deterioration in the outlook for AI investment, whether through weaker corporate guidance, financing difficulties or regulatory intervention, could prompt investors to reassess the valuations attached to some of the market’s biggest companies.
Inflation and the Federal Reserve represent another potential catalyst. If more inflation readings surprise on the upside, expectations for interest rates could rise even further, pushing Treasury yields higher and putting pressure on equity valuations. Technology stocks, whose valuations are particularly sensitive to changes in discount rates, would be especially exposed.
Geopolitics should not be overlooked either. A renewed escalation involving Iran, particularly if it sends oil prices sharply higher, could reignite inflation concerns and make the Fed’s job considerably more difficult.
Finally, earnings expectations will need to be justified. The market has become increasingly dependent on sustained profit growth to support elevated valuations. Any indication that corporate earnings or AI-related spending are losing momentum could trigger a broader reassessment of risk.
S&P 500 forecast: A deeper pullback before year-end?
A further correction over the coming weeks looks entirely plausible, although that does not necessarily mean the broader bull market is approaching its end. After all, seasonality could work in the market’s favour, with the final weeks of the year historically tending to be supportive for US equities. But seasonal patterns are no guarantee, particularly when valuations are stretched and investors are increasingly sensitive to changes in the inflation and interest-rate outlook.
My assessment is that the S&P 500 could experience another bout of weakness before the year is out, particularly if AI-related concerns intensify or inflation data force markets to price in an even more hawkish Fed rates trajectory. A 5–10% correction would not be especially surprising in this environment, nor would it necessarily invalidate the longer-term bullish case.
The more important question is whether earnings growth and investment spending remain strong enough to absorb these pressures. For now, they are providing Wall Street with a degree of protection that other markets do not enjoy. But if that support begins to weaken, the S&P 500 may find it considerably harder to defy the global market downturn.
Key levels to watch on S&P 500
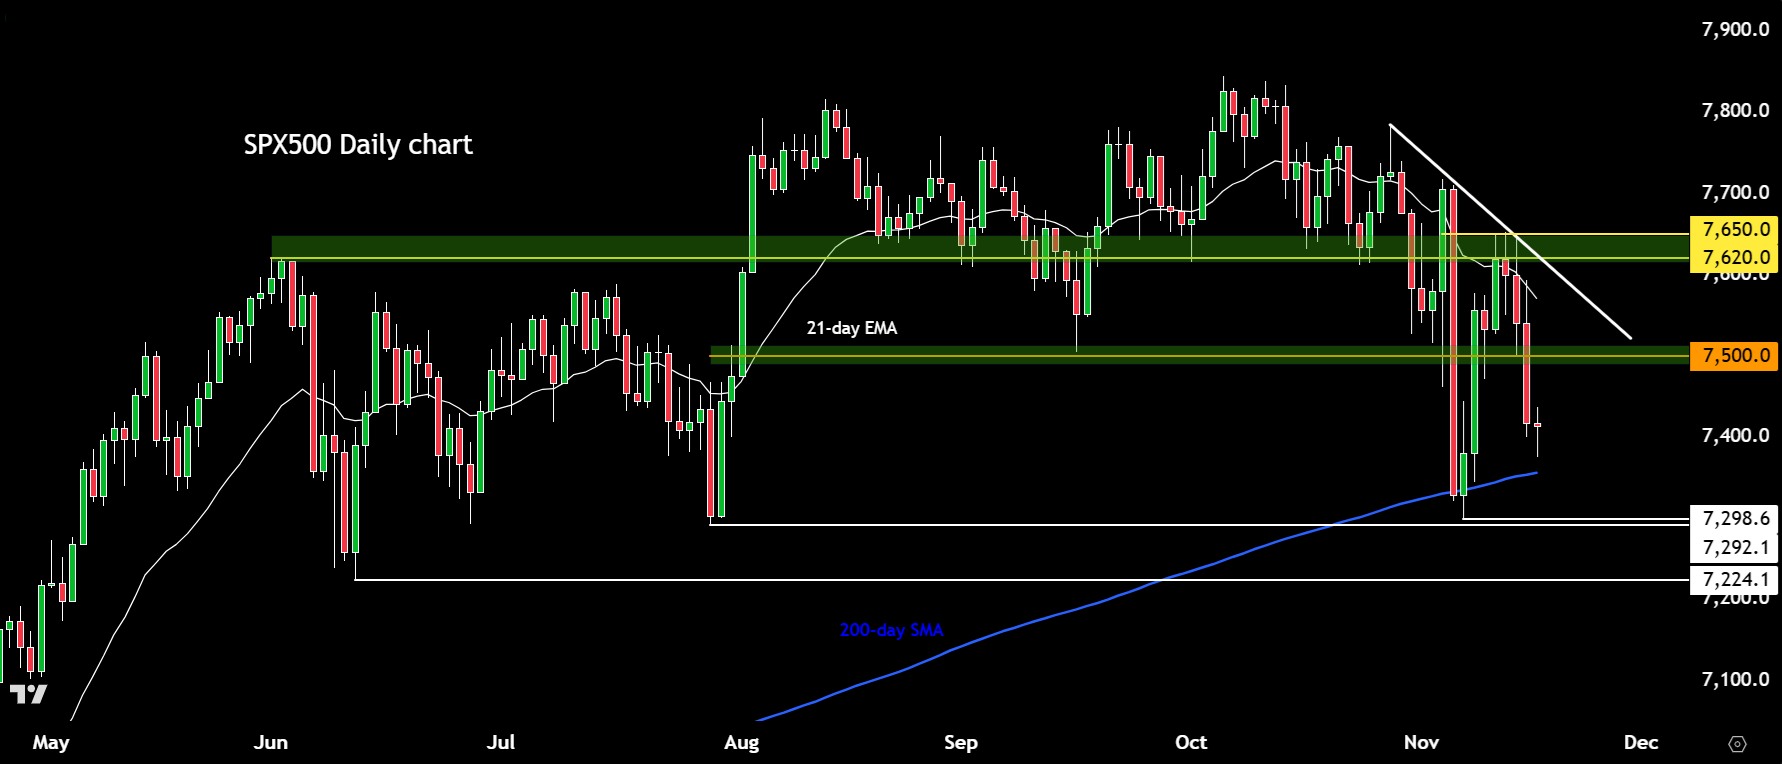
From a technical point of view, we’ve seen the S&P 500 form a series of lower highs following the bearish price action that has been in place since the market peaked in early October.
The index fell for five consecutive weeks before staging a sharp recovery last week. However, that rebound has already encountered strong selling pressure at the start of this week, ahead of Nvidia’s earnings.
Clearly, the trend is no longer as strong as it once was. However, suggesting that the market has peaked may still be a little premature. We need to see further price action before concluding that the market has indeed topped out.
For now, let’s see how things unfold over the next few days. We’ll take it one level at a time and reassess the situation as the market develops.
Our SPX500 chart, above, which is derived from the underlying S&P 500 futures, resistance is now seen around the 7,500 level. This area previously acted as both support and resistance. It was tested on Monday before the index broke below it on Tuesday, so a retest of that level could offer a tradable opportunity on the short side.
Of course, the market could reclaim 7,500. But even then, it would need to overcome the next resistance zone between 7,600 and 7,650, before we could have a stronger signal that the market has bottomed out.
If that doesn’t happen, then the more likely scenario is a continued drift lower, particularly given the deterioration in risk sentiment across other markets.
On the downside, the 200-day moving average has recently been tested and has so far provided some support. That average currently comes in around 7,355.
Below there, we don’t have much in the way of significant support until the recent lows around 7,298, followed by the July low near 7,292.
A break below that area could signal a change in market structure and open the door to a deeper correction towards the psychologically important 7,000 level, which also marked a previous resistance area earlier this year.
We could potentially see an even larger decline, but for now, 7,000 would be our immediate downside objective.