
It was a pullback week for the USD but at this point there’s still potential for bullish scope in the currency. I looked into three support zones in the Tuesday webinar, and the first two have been violated so far while the third remains un-tested. Notably, that third zone is some remaining unfilled gap from earlier in October, and as I said in the webinar, while I’d prefer USD-strength to bring some fresh trends to the FX market, price action is objective, and there were bullish reversal formations in two the largest components of DXY, both of which filled into breakout by the end of the week.
For next week, we get some US data of interest with the CPI report on Friday. In DXY, it’s that remaining unfilled gap that marks a significant line in the sand for the greenback, and I think there’s an attractive tie to the EUR/USD setup that I’ll look at in a moment.
US Dollar Daily Price Chart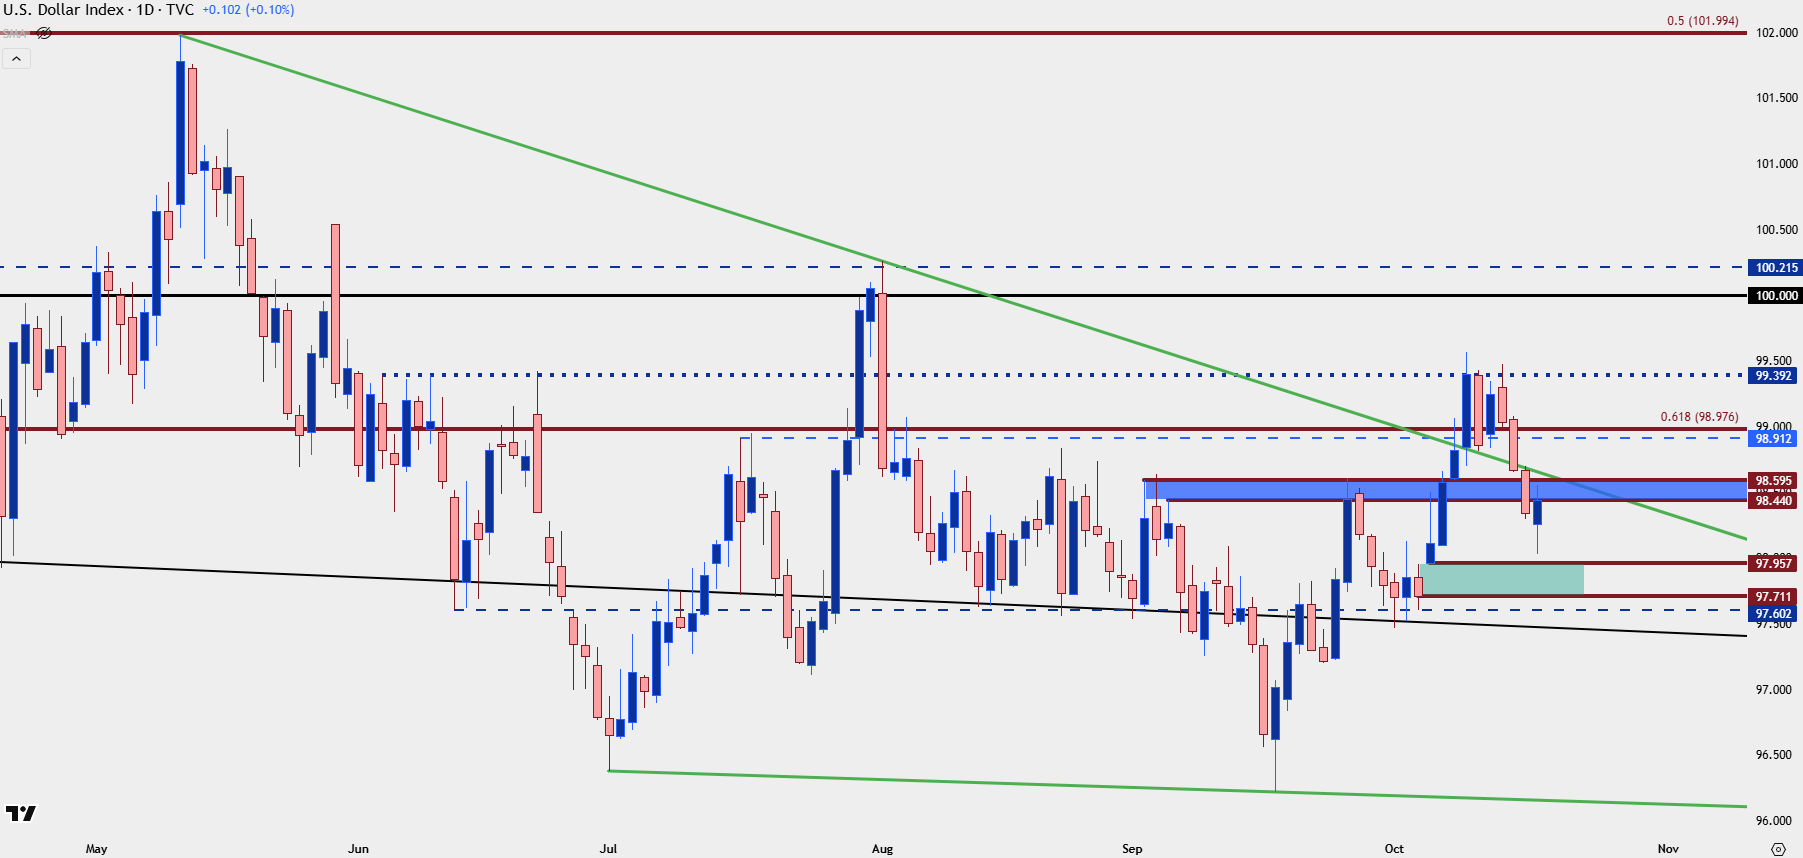
Chart prepared by James Stanley; data derived from Tradingview
EUR/USD
From the daily chart of EUR/USD, a lower-low and lower-high sequence can still be argued. But the pair stalled at support of 1.1543 and when I looked at on Tuesday, there was a double bottom formation that was in-play. Those are bullish reversal formations and that’s what panned out later in the week, with the pair running up to the projected move before finally stalling.
So, while there’s the lower-low and lower-high sequence on the daily chart, shorter-terms accentuate that recent rally and show higher-highs and lows. This is what makes the 1.1631 level so important, as this was the prior neckline from the double bottom formation. If bears can take that out, short-side continuation will look more attractive, with the idea that resistance held at the key Fibonacci level of 1.1686.
EUR/USD Daily Price Chart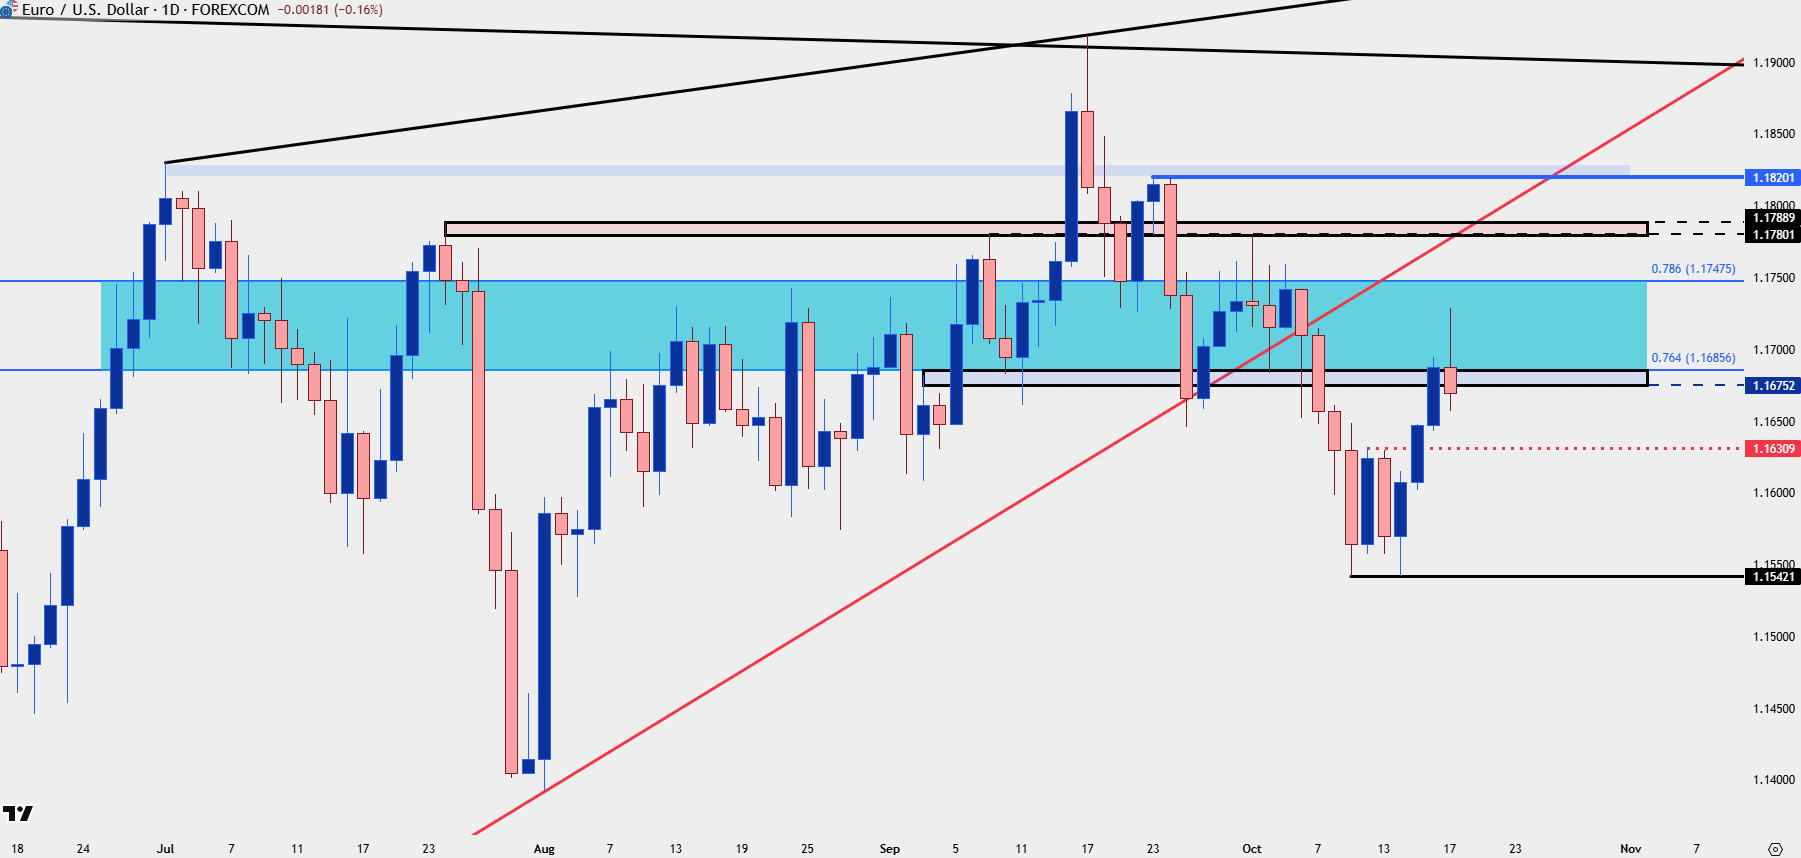
Chart prepared by James Stanley; data derived from Tradingview
GBP/USD
GBP/USD is the pair I like a bit better for USD-weakness, at the moment. Like EUR/USD, there was a bullish breakout formation brewing at the Tuesday webinar, but in Cable, that was in the form of a falling wedge. The breakout took hold later in the week and as seen on the four-hour chart below, that led to a break of higher-highs and there’s now a test for a higher-low right at the key Fibonacci level of 1.3414.
The prior resistance zone runs down to 1.3353-1.3372 and that’s the spot that bulls need to hold to retain control. If they fail there, my assumption is that EUR/USD will have or will be nearing a test below 1.1631, and there will simply be more attractive avenues for USD-strength elsewhere.
GBP/USD Four-Hour Chart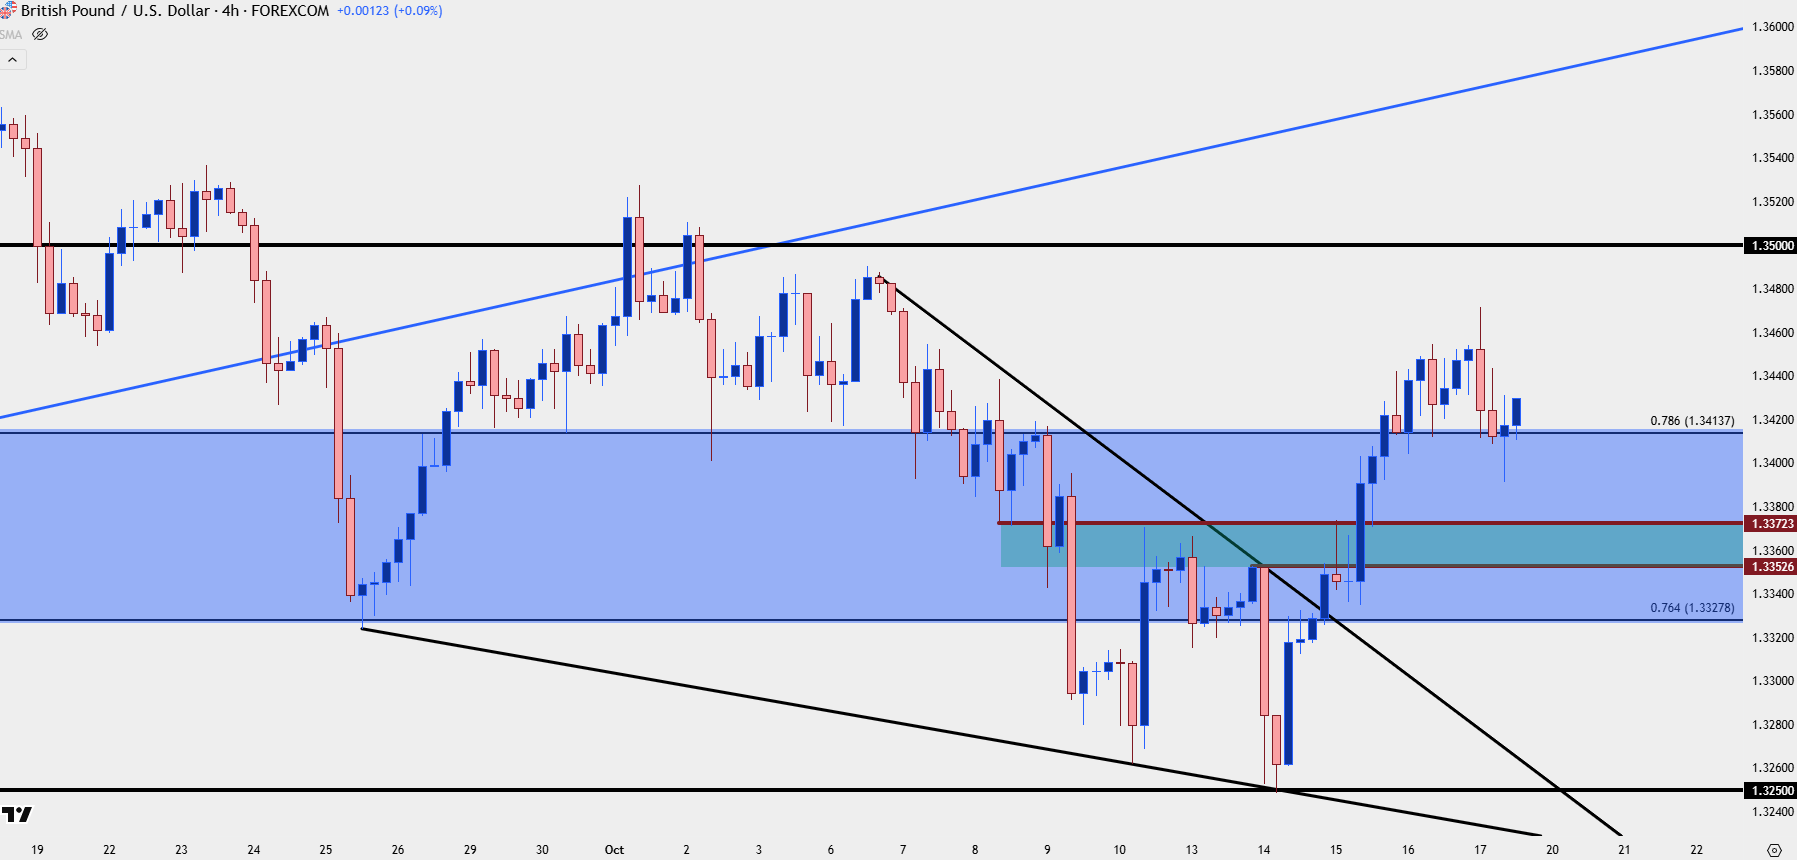
Chart prepared by James Stanley; data derived from Tradingview
EUR/JPY
I looked into this setup in an article on Thursday and since then we’ve had a pullback to support at the 175.00 handle, which was prior resistance.
EUR/JPY Daily Chart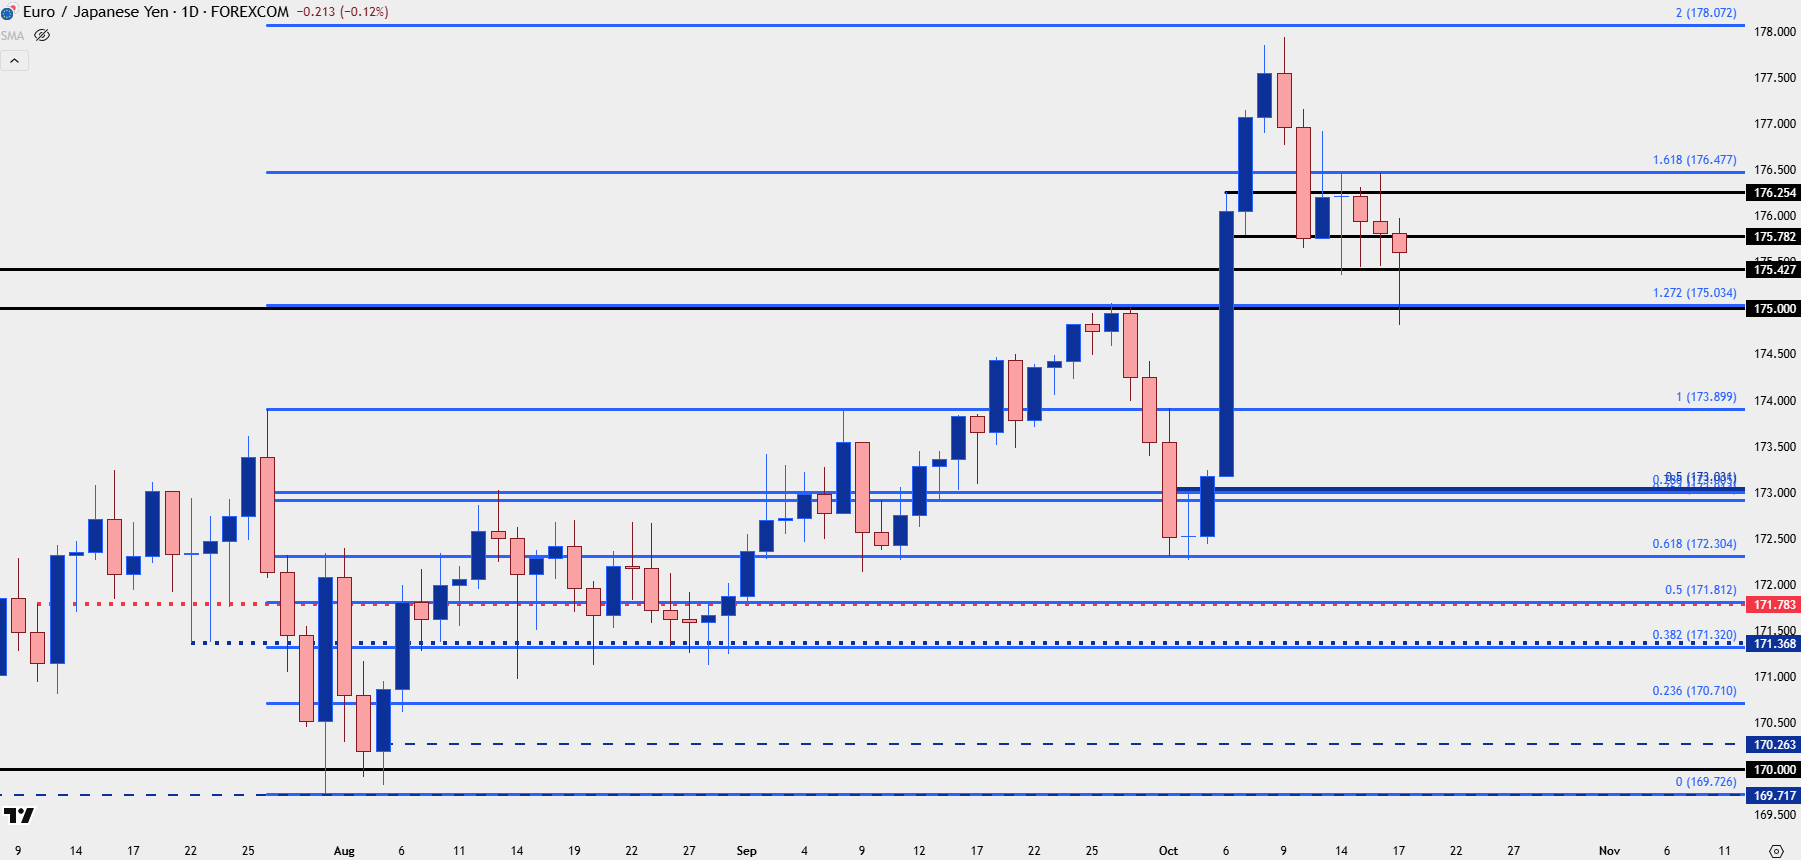
Chart prepared by James Stanley; data derived from Tradingview
--- written by James Stanley, Senior Strategist