
U.S. Dollar Talking Points:
- After setting a fresh three-year low on the first day of Q3 the USD has bounced up to a test of resistance at 98.00 looked at in last week’s webinar.
- EUR/USD continues to show inflections at the 2021-2022 Fibonacci retracement, with short-term lower-lows and highs appearing.
- USD/CAD appears attractive for USD-weakness to continue and for USD-strength, we’ll likely need to see continued strength in the USD/JPY pair.
- This is an archived webinar and you’re welcome to join the next one. Click here to register.
The U.S. Dollar came into Q3 oversold on both the daily and weekly charts, so the bounce that we’re seeing over the past week could simply be a pullback from that stretched positioning as sellers have controlled the currency for much of 2025 trade. In last week’s webinar, I looked at a few different resistance levels of note, and at this point, it’s the zone around the 98.00 handle in DXY that’s coming in to hold the highs.
From the four-hour chart below, we can see that recent patterning of higher-highs and lows, opening the door for a larger pullback.
With that said, the larger trend is still bearish as this has been only a mild retracement of the sell-off in the first-half of the year, which I’ll look at below.
U.S. Dollar Four-Hour Chart

Chart prepared by James Stanley; data derived from Tradingview
From the bounce earlier in Q2, the big question is if or when sellers come in to respond to the larger trend. In May, it was the Fibonacci level at 102.00 that remained defended, leading to the fresh three-year lows at the Q3 open.
At this point, we have an illustration of short-term resistance showing at prior support, the same support that came into play on Easter Monday and led to that bounce into early-May. And above that are a Fibonacci level at 98.98 followed by a swing high at 99.39. If bulls can force a break above that – then larger pullback scenarios can start to become attractive.
U.S. Dollar Daily Chart
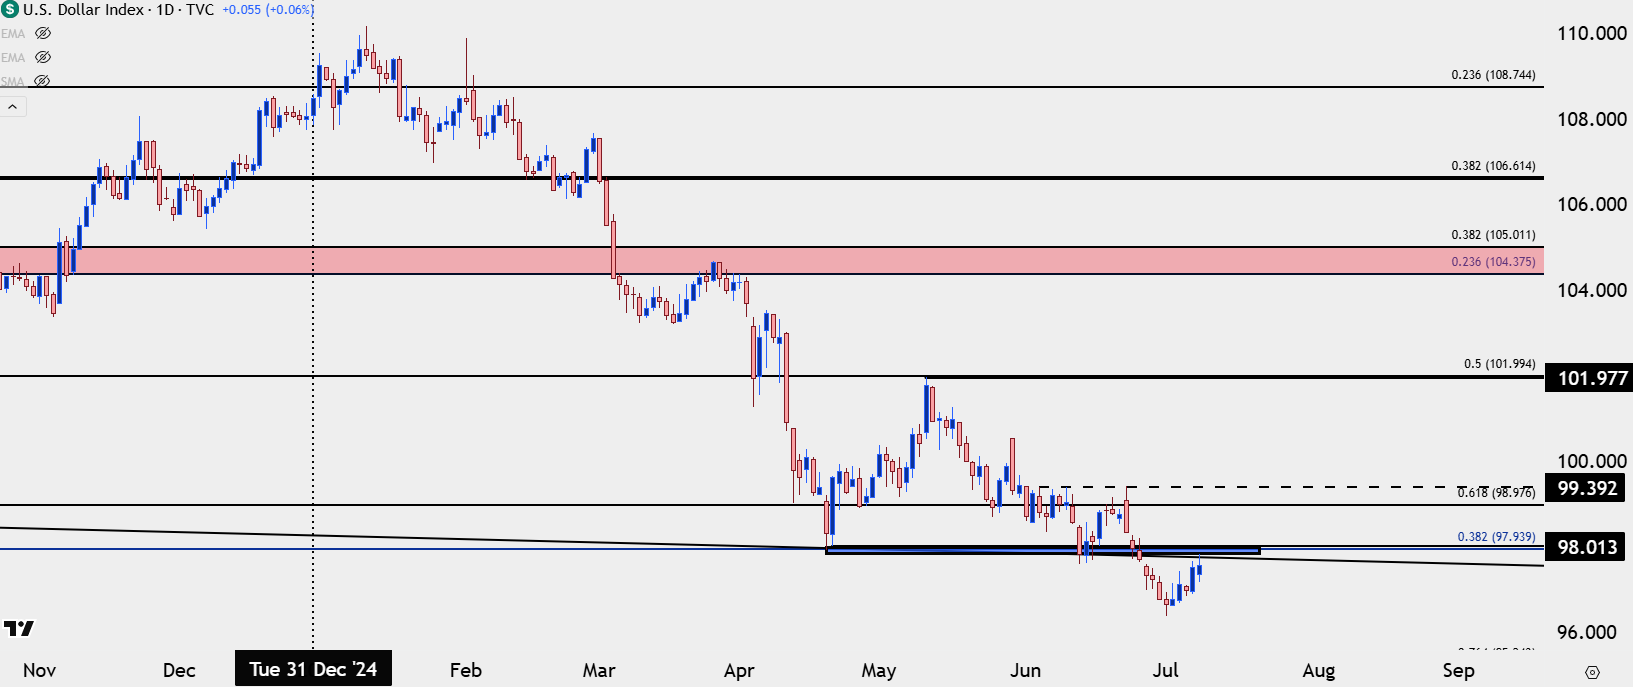
Chart prepared by James Stanley; data derived from Tradingview
EUR/USD
As USD showed oversold readings around the Q3 open EUR/USD showed overbought, and weekly RSI had gotten to its most overbought in more than seven years.
This is a stark contrast to the oversold conditions for the pair in the opening days of 2025, just before the low was set upon a test of the 23.6% Fibonacci retracement of the 2021-2022 major move.
At this point, the same 76.4 and 78.6% retracements remain in-play and we can see where those prices have helped to set both support and resistance, and from the four hour there’s been a very early build of lower-lows and highs. This keeps the door open for a deeper pullback, with follow-through supports at 1.1632 and 1.1573, after which a zone comes into the picture from 1.1524-1.1543.

EUR/USD Four-Hour Chart

Chart prepared by James Stanley; data derived from Tradingview
GBP/USD
The pullback in Cable seems a bit deeper than what’s shown in EUR/USD so far. This doesn’t necessarily preclude bullish continuation, but it does highlight caution.
The support looked at in last week’s webinar at 1.3593-1.3617 had held until this morning; and the daily bar below highlights that it may hold into the end of the day. If it does, bullish setups would be a touch more attractive, in my opinion, but I still think there could be more attractive venues for USD-weakness elsewhere, such as USD/CAD, perhaps.
Nonetheless, the 1.3500 level in GBP/USD has been a big spot historically and we haven’t yet seen a support test there since the resistance test in late-June. So, where this one seems attractive is if we do get a USD pullback stretching a bit more to allow for GBP/USD to temporarily test 1.3500; and if there is a defense of support, that can open the door for short-term reversals, which may lead into bigger picture trend continuation.

GBP/USD Daily Price Chart

Chart prepared by James Stanley; data derived from Tradingview
USD/CAD
At the time of the webinar, USD/CAD had started to test a zone of resistance taken from prior support, running in the 1.3679-1.3694 region. The 1.3750 level held two different resistance attempts in June and there hasn’t been a single daily close above that price since May. As I said in the webinar, USD/CAD can remain attractive for bearish USD scenarios.
USD/CAD Daily Price Chart
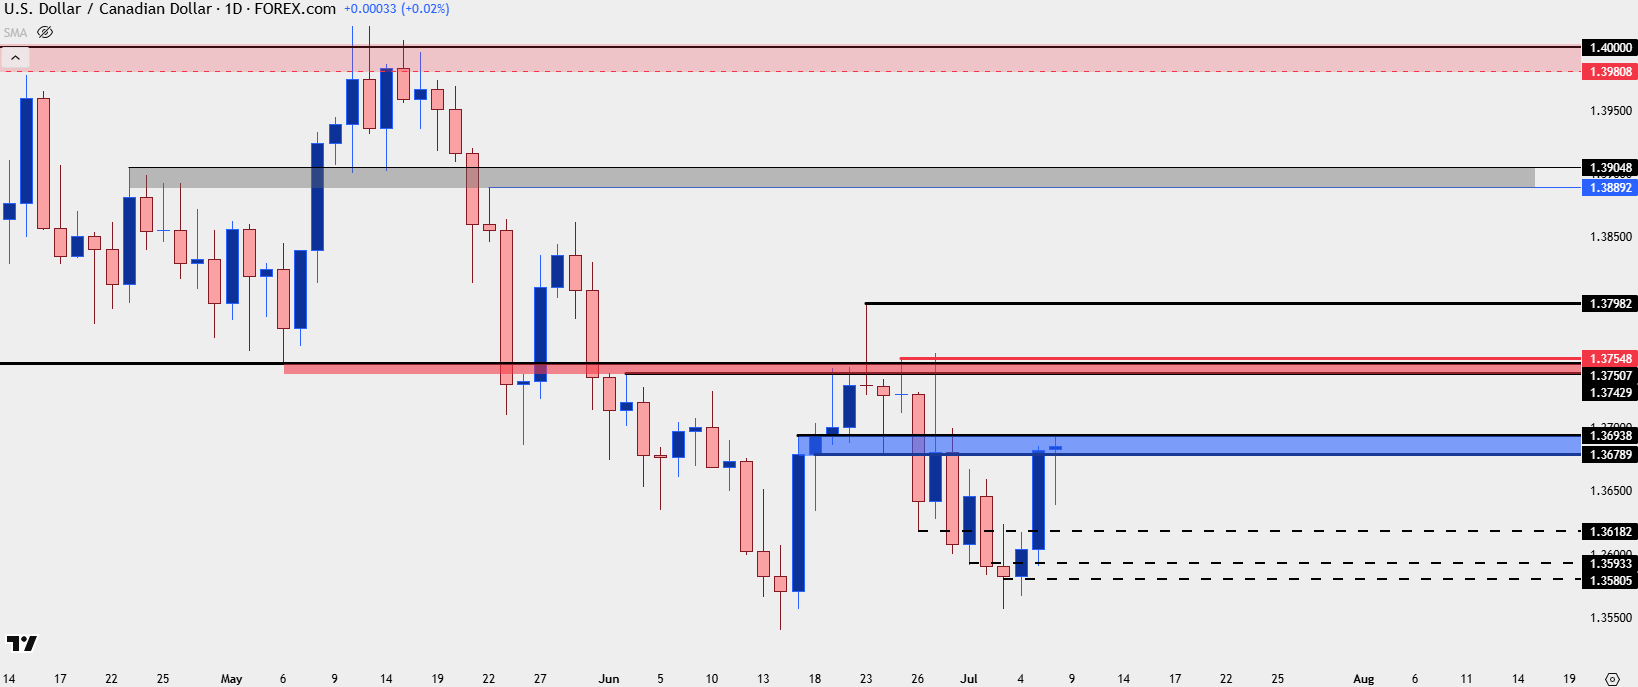
Chart prepared by James Stanley; data derived from Tradingview
USD/JPY
Since the low was set just after the Q3 open USD/JPY has made a strong move-higher, and if we are going to see larger pullbacks in the USD backdrop it’ll likely need some help from bulls in USD/JPY. At this point, the 148.00 level is a hardened level of resistance as that held the highs through Q2, most recently a couple of weeks ago following the FOMC rate decision. There’s now support potential at 145.92 and perhaps more attractively, the 145.00 handle, both of which can keep the door open for bullish continuation up to a re-test around 148.00.
USD/JPY Four-Hour Chart
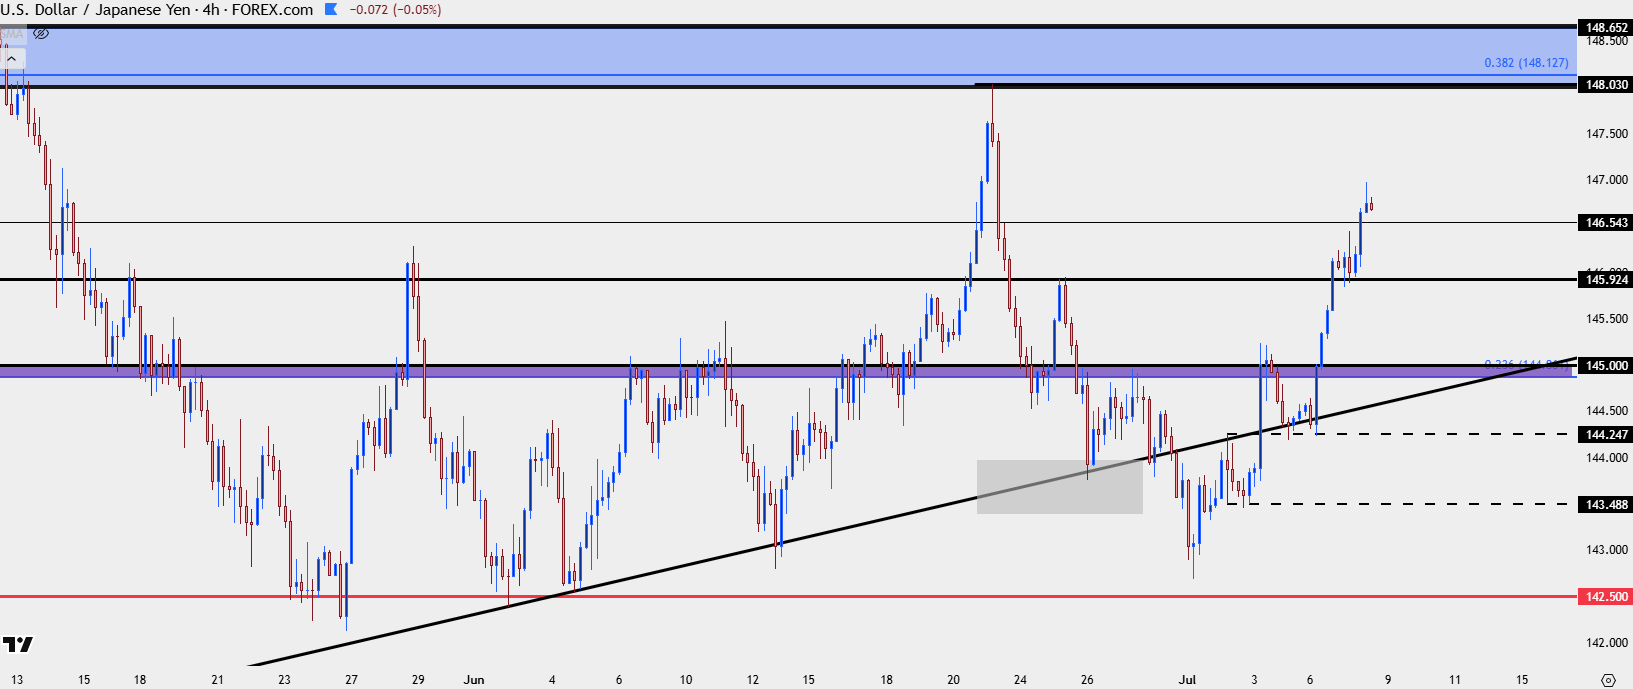
Chart prepared by James Stanley; data derived from Tradingview
--- written by James Stanley, Senior Strategist