

Jerome Powell didn’t feed the doves at today’s presser even though the FOMC projections issued at 2PM ET didn’t seem all too hawkish. While the Fed is looking for higher levels of inflation than they were at the last quarterly rate decision in December, they also boosted forecasts for growth this year while maintaining the expectation for the unemployment rate at 4.4%.
The reaction in markets is perhaps the most important takeaway and at this point US equities are at session lows following a strong reversal in the Russell 2000 index after having visited key support at 2556 earlier this morning. I looked into those backdrops in equities over the weekend and the support zones in each all remain in-play as we push past the halfway point of the week.
In currencies, however, much remains to be seen as we have rate decisions out of Japan, the UK and Europe through tomorrow morning; and those are the three largest components of the DXY basket in the Yen, Pound and Euro so DXY still very much remains in focus.
If you want a fundamental rundown of today’s FOMC meeting, Matt Weller just covered that in his post-Fed piece. In this article, I’ll be looking at the technical backdrop with updates from yesterday’s webinar, as structure remains in-place from that.
For DXY structure, yesterday saw a test of support and that support has since held at 99.48. The falling wedge that built into this morning has been broken and buyers are already pushing back above the 100 level, with 100.22 and 100.54 as the next waypoints overhead.
Interestingly, while expectations are still largely for the Fed to cut this year, rising expectations for as many as two rate hikes out of the ECB hasn’t been able to reverse the sell-off that’s remained in place in the Euro and I’ll look at that chart in just a moment.
US Dollar Hourly Price Chart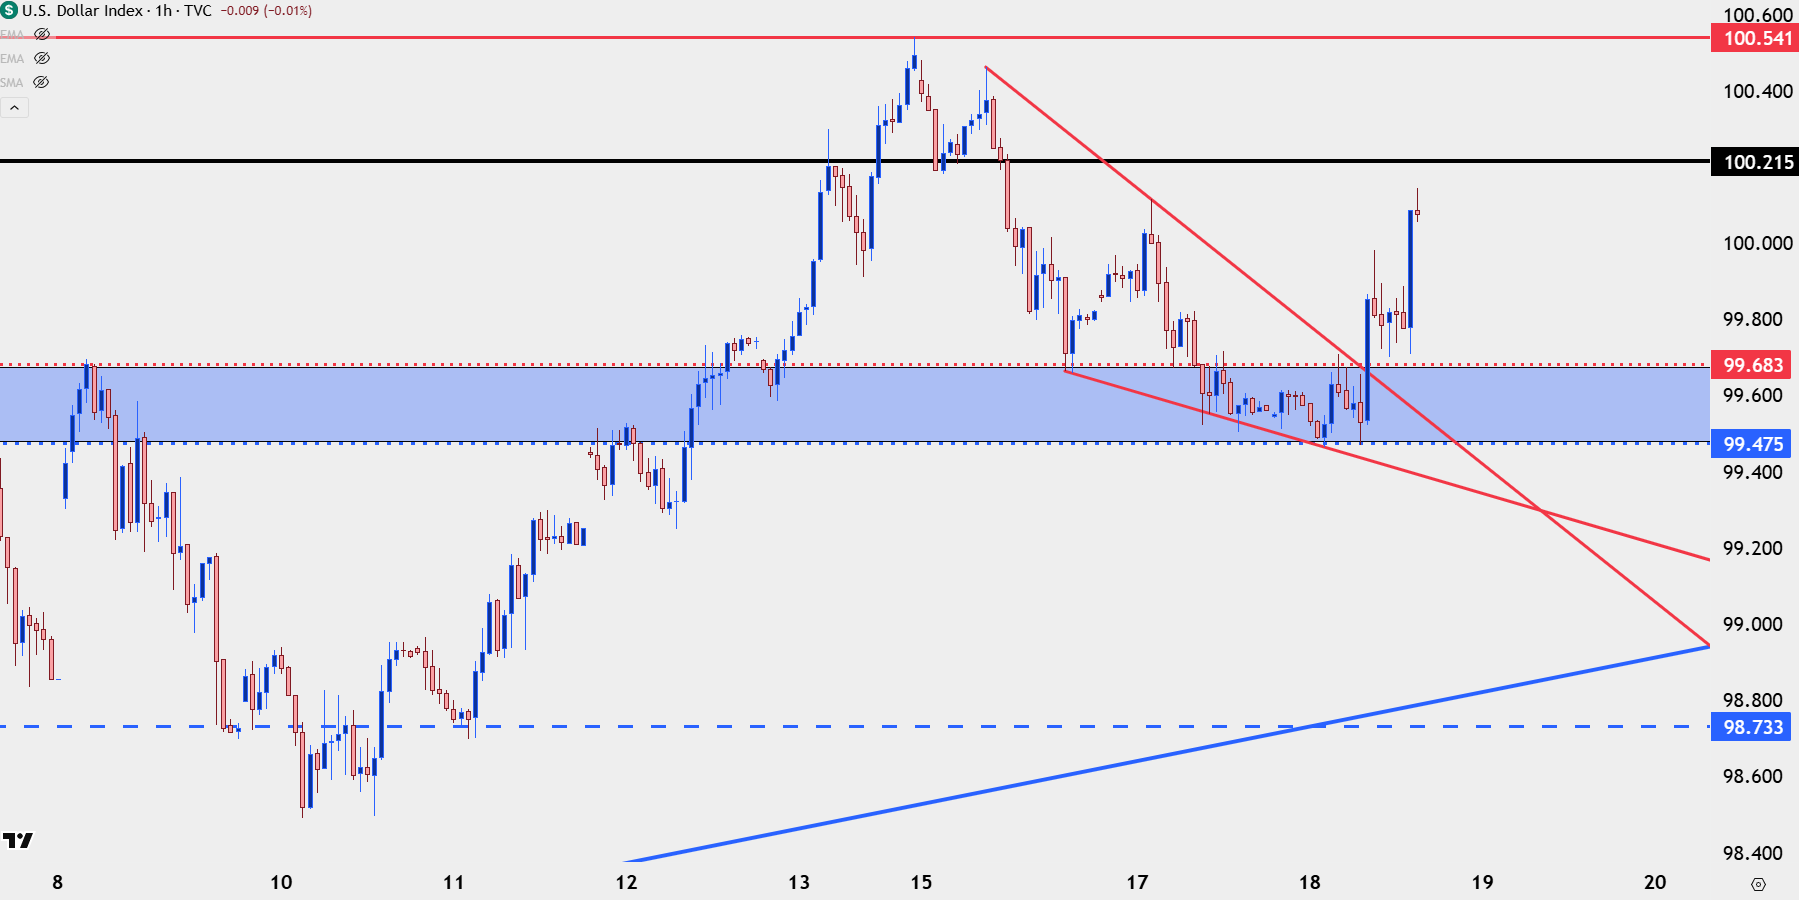
Chart prepared by James Stanley; data derived from Tradingview
USD Bigger Picture
It was an ascending triangle that had built in the USD in February that led to the March breakout. And longer-term, there’s now another ascending triangle in-play with the current resistance level after numerous inflections and reversals last year. If the USD breaks out on the back of the Central Bank meetings on the calendar we can be looking at a very different reality in the not-too-distant future, as there’s not much to stop the move until the 102.00 handle comes into play. And given that we’ve already seen equities tripping backwards today I think the ramifications of such a move in DXY could be far reaching. But, there’s a chance that doesn’t happen and I think whether or not it does will boil back to the BoJ which I’ll touch on in a moment.
USD/JPY Daily Price Chart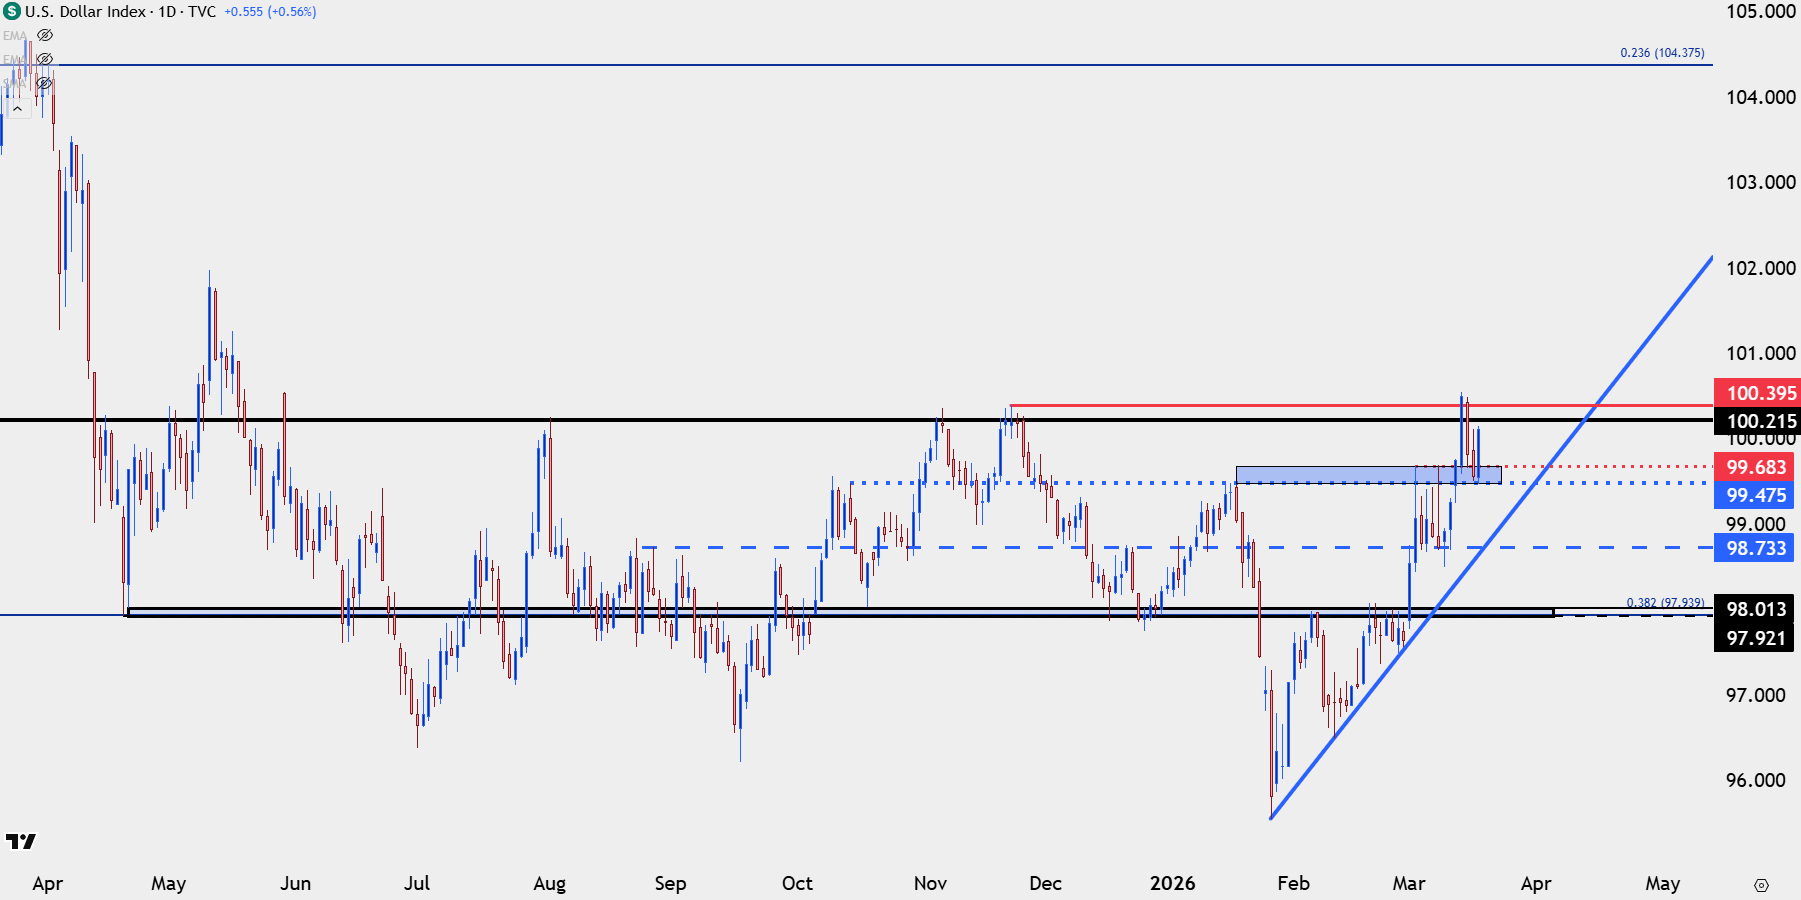
Chart prepared by James Stanley; data derived from Tradingview
EUR/USD
When the USD broke down in late-January the move seemed to be mostly fueled by USD/JPY. This might not sound sensible given that the Yen is just a 13.6% component of the DXY basket, but looking at the longer-term chart explains this better as the built-in long positioning behind the carry trade shows a crowded market position, and if it does begin to unwind the consequences can be massive – to the point where even USD/JPY selling could drive rallies in EUR/USD, much like we saw in late-January when the EUR/USD pair went into deep overbought levels while trading above the 1.2000 handle.
Interestingly the rates backdrop around Europe is now more hawkish, with markets expecting as many as two rate cuts from the ECB this year. You wouldn’t know it from looking at the EUR/USD chart, however, as the pair continues to grind on the 1.1500 level after having pushed into oversold territory on the daily chart just a little more than a month after going overbought.
EUR/USD Daily Chart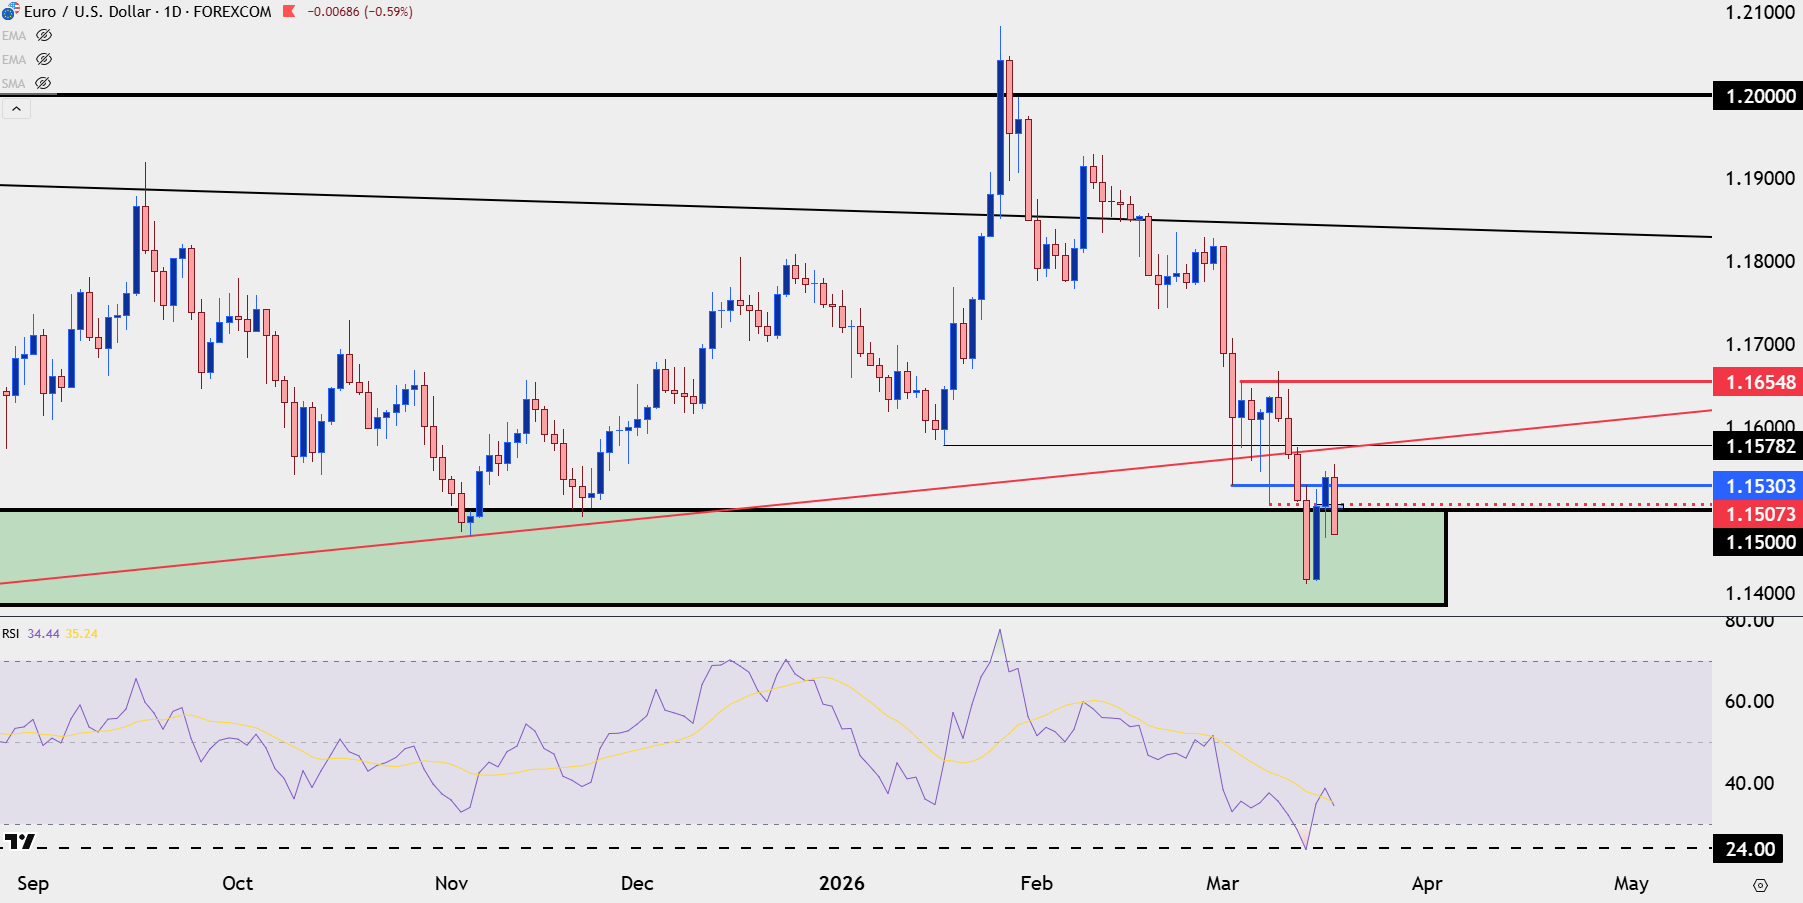
Chart prepared by James Stanley; data derived from Tradingview
EUR/USD Shorter-Term
Given the trend I think it’s probably easy to be bearish on EUR/USD at the moment. But – what we saw in both USD and EUR/USD in January and early-February can be informative.
When we get a deep oversold read like we had in EUR/USD last week, the backdrop is ill suited to chase the trend. Instead, waiting for a pullback to see how sellers respond can highlight continuation potential which, so far, has held as bears are pushing prices back below the 1.1500 level.
That mirrors the USD backdrop from a couple months ago quite well, when DXY went deep into oversold territory which was followed by a pullback to 97.94. But – it was the reaction to that resistance – which set a higher-low that built the ascending triangle. And that’s the formation that led way to the March breakout in the pair.
In EUR/USD terms, we’ve seen the pullback, and we’ve seen the response from sellers. The question now is whether they can stretch it down to a fresh low or whether buyers step in to hold a higher-low that can lead into bullish counter-trend themes.
With ECB on the cards for tomorrow this would probably need to be pushed by a hawkish outlay from Christine Lagarde at the press conference, designed to strengthen the single currency in order to buffer inflationary pressure, even if just a little bit.
EUR/USD Four-Hour Chart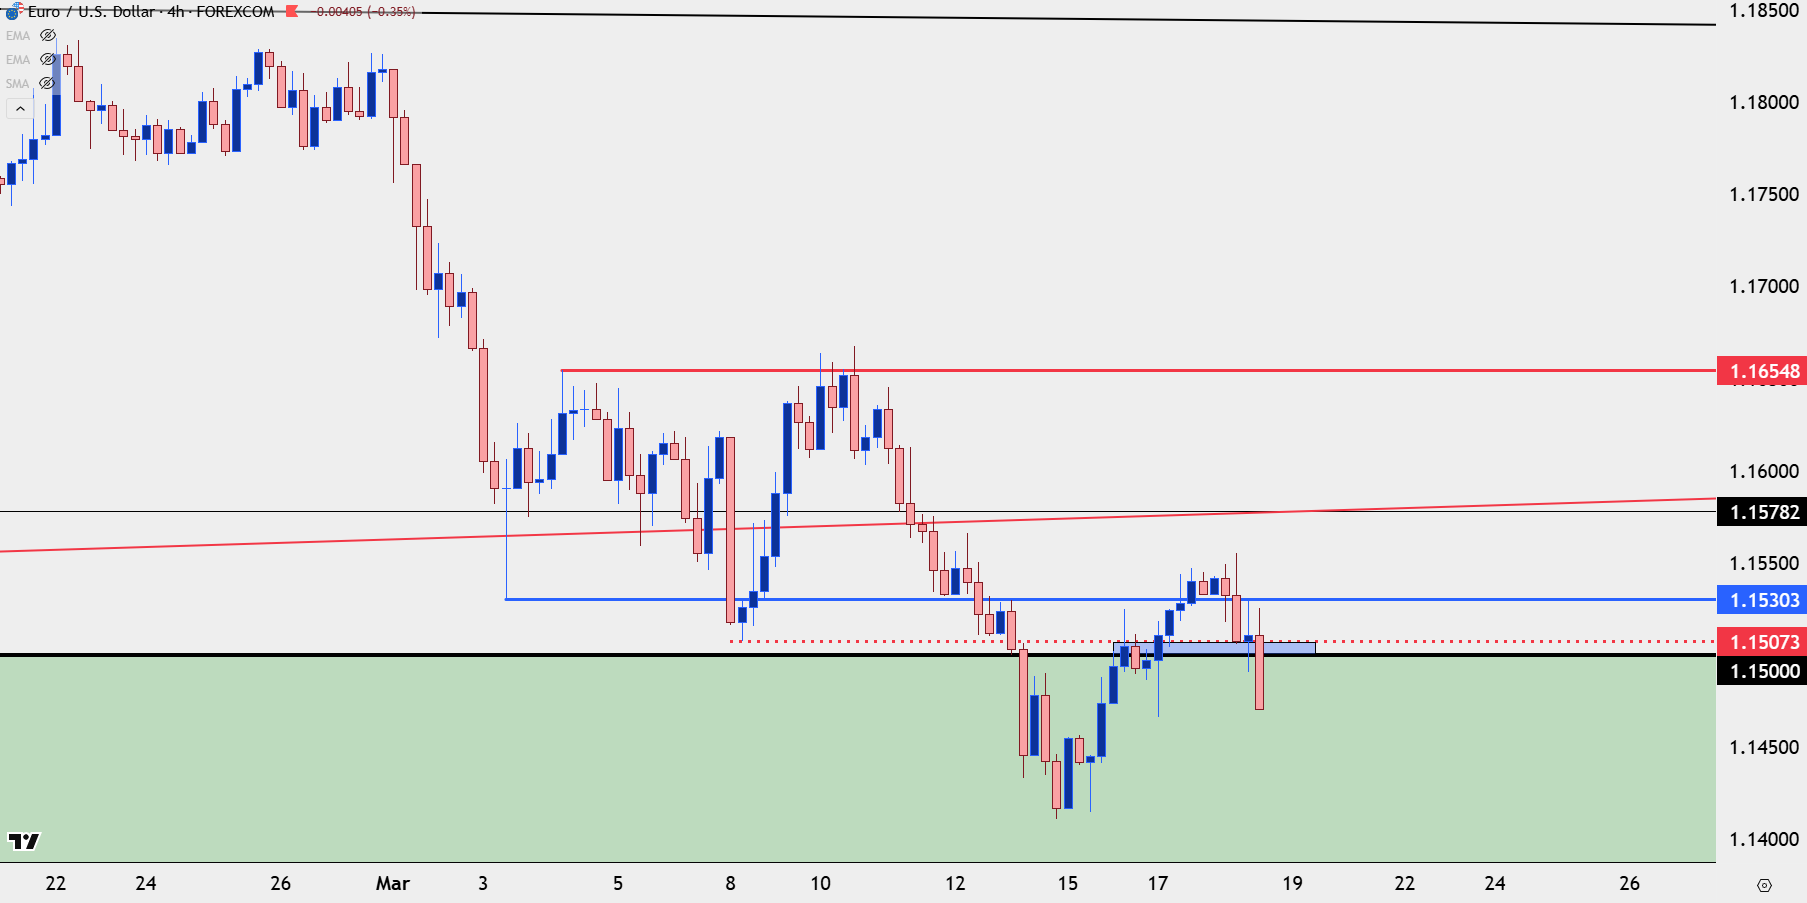
Chart prepared by James Stanley; data derived from Tradingview
USD/JPY
It was the late-January BoJ meeting that sent DXY spiraling deeply into oversold conditions, and that rooted from a hint from Kazuo Ueda that the BoJ might be getting more-hawkish in the not-too-distant future.
But, inflation numbers were soft in February and that removed some of that pressure, although a recent spike in oil prices threatens to upend that trend. As of this writing, USD/JPY sits at a fresh yearly high, getting closer and closer to a 160.00 test. It’s difficult to imagine that this won’t be at least partially considered by Ueda ahead of tonight’s meeting, and it should provide some motive for being balanced if not leaning more hawkish entirely.
It’s if he doesn’t that the range of scenarios widens dramatically, as that first re-test above 160.00 may draw the ire of the Japanese Finance Ministry, and given the built-in long position in the pair a pullback can very quickly take on the tone of reversal – and those ramifications can be felt across the DXY complex.
USD/JPY Weekly Chart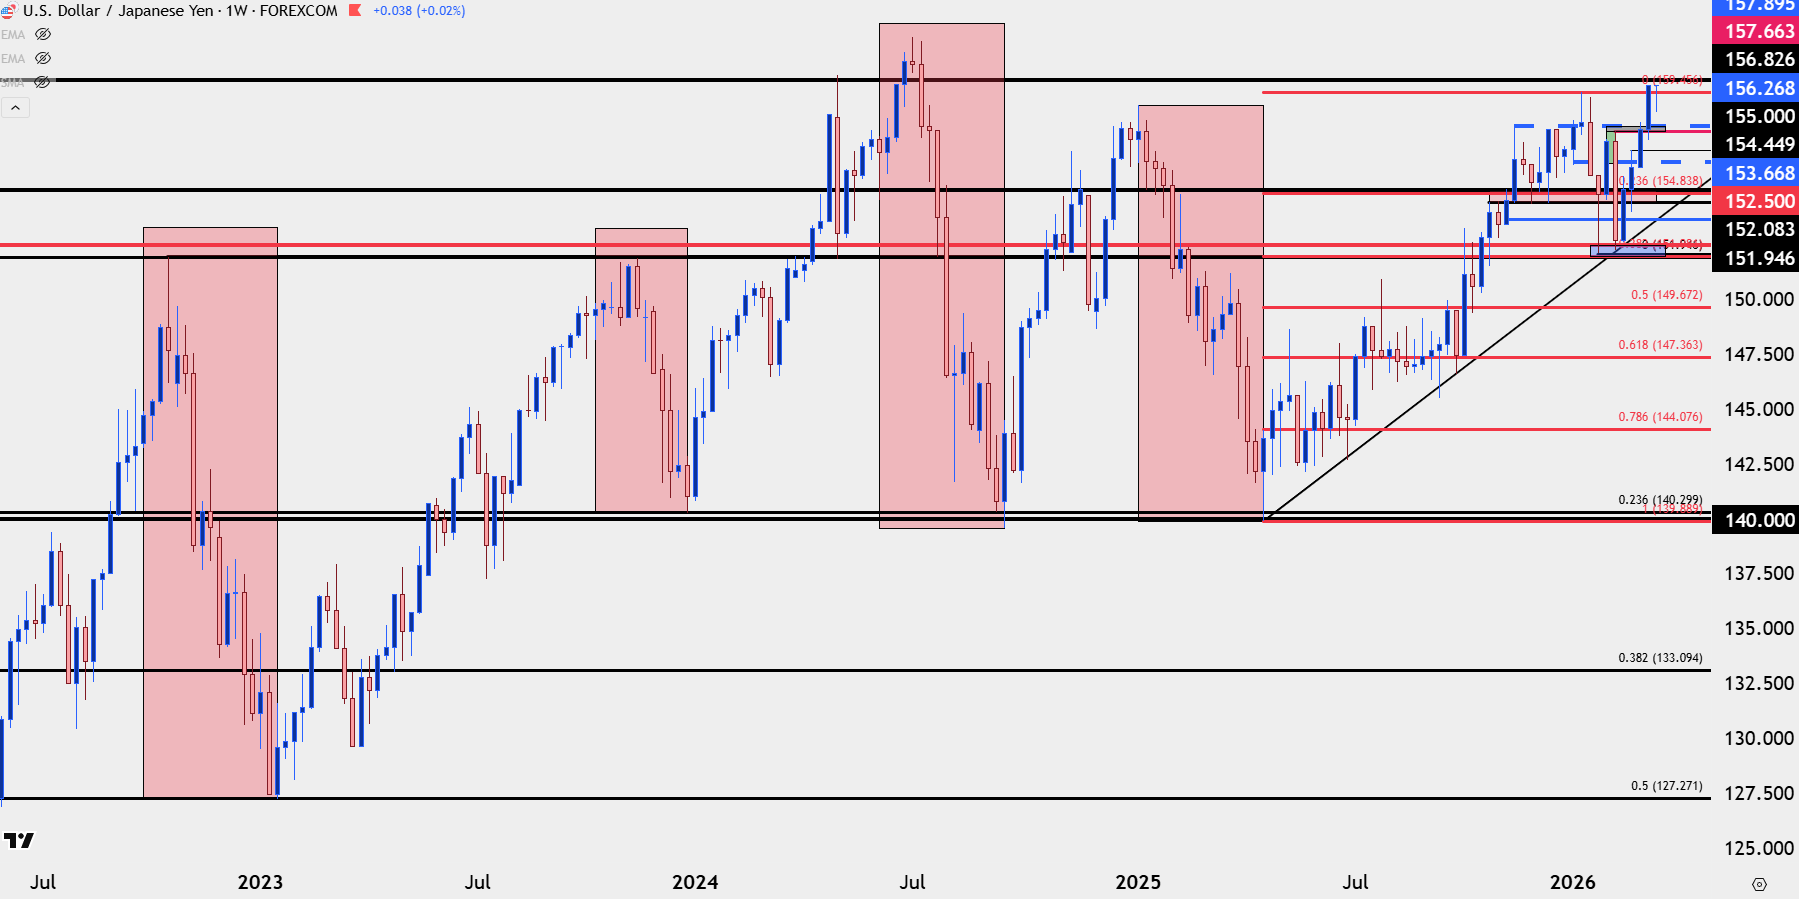
Chart prepared by James Stanley; data derived from Tradingview
--- written by James Stanley, Senior Market Analyst, Global Macro