

Talking Points:
- The second bear phases of October ended with BTCUSD finding a rough floor in the 38.2% Fib of the April low to October high bull run
- Technical boundaries for most major coins are blurred by the volatility from October 17th and the large ‘wicks’ left
- Recent congestion may point to a nearer term break, but momentum will depend on the direction and broader financial market conviction
Performance of Major Cryptocurrencies

Source: Data – StoneX, TradingView
- Bitcoin may have established a rough floor around 106,000, but the 20-day average true range (a measure of actualized volatility) has climbed to a six-month high.
- Of the major coins we are following, Solona is the only one that was higher at Friday’s close than where it was 10 weeks ago.
- Year-to-date there is a significant skew in terms of performance split between the strong green for the most popular coins (Bitcoin, Ethereum, Ripple) and losses for second tier (Doge, Litecoin and Cardono).
- A discernible bearish pressure was traded for broader congestion this past week, but the underlying level of volatility makes a subsequent break to establish the next leg of a trend a high probability risk.
Major Cryptocurrencies’ Correlation Over 20-Day Period
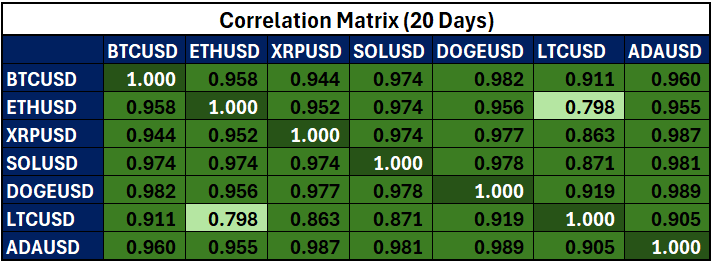
Colors from red to green – Red indicates negative correlations, and green indicates positive correlations.
Source: Data – StoneX, TradingView
Correlation across the major cryptocurrencies has firmed up significantly in the rolling 20-day period despite a notable shift towards congestion. That is atypical as strong trends more frequently pulls similar assets into alignment as momentum leads traders in the asset class to seek out comparable counterparts.
Notably, there is a strong correlation base across the major and secondary coins when measured against Bitcoin. That could indicate a focus on the heaviest market-cap coin as traders seek direction from the more establish congestion that has formed of late.
An outlier to note in the correlation table is the weaker – though still strongly positive - 0.798 – correlation between Ethereum and Litecoin. A look to their respective charts shows they reflect the exaggerated extremes of the shift from a crypto market tumble to congestion. Notably, ETHUSD experienced a much less extreme drop on Friday October 10th and the subsequent Friday October 17th – where more exaggerated ‘lower wicks’ formed for many coins.
Further, Ethereum has worked its way into a much more established wedge formation while Litecoin was seemed to be gaining traction on a push through the upper bound of its own wedge through Friday.
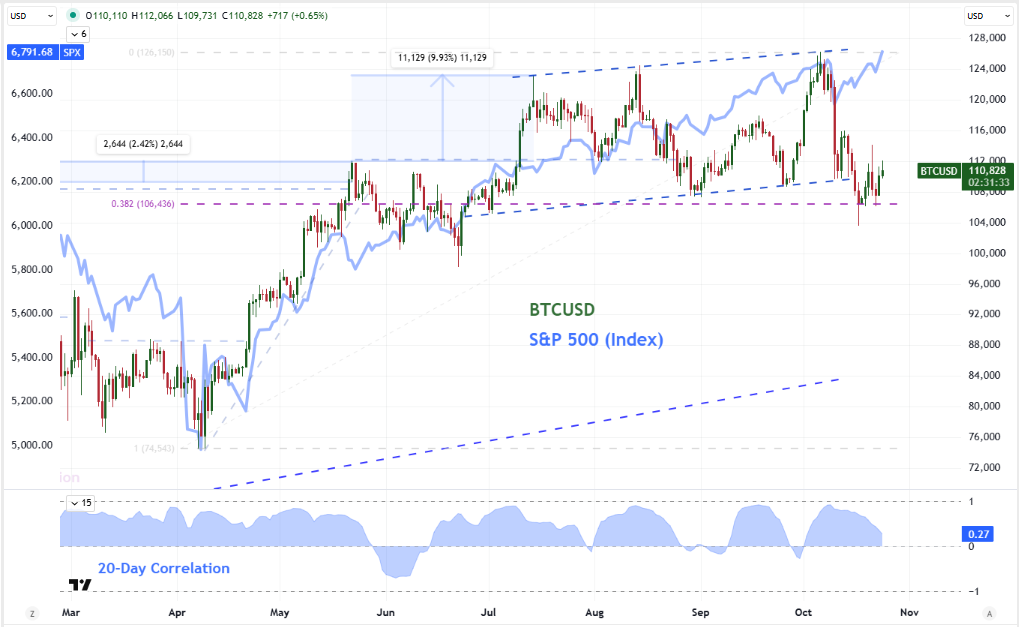
Chart of BTCUSD Overlaid with S&P 500 and 20-Day Correlation (Daily)
Source: Data – StoneX, TradingView
Bitcoin offers a clear read on the transition from phases trends to established congestion that we have seen across the crypto set. There remains exceptional volatility underlying the market though – moreso than many of the other ‘risk assets’. That raise the risk of sudden price action and perhaps even technical breaks. Then again, this asset has shown a diminished respect for hard and fast technical levels amid this elevated activity.
It is worth keeping tabs on parallel risk asset benchmarks to gauge conviction through the broader financial system. Even though BTC has seen its correlation to the S&P 500 slacken lately, there is still a propensity for the markets to align under strong trend – particularly when it originates from the TradFi space.
Key Levels:
- $116,000 – Significant Resistance: The midpoint of BTCUSD’s volatile range from this past month is just shy of 115,000, but the previous swing high and psychological influence of the 116,000 could well extend the influence of this zone.
- $106,500 – Core Support: Thought Bitcoin had pushed intraday/week through this level during the volatility of October 10th, there were no daily session closes below this 38.2% Fib of the April – October bull trend extremes.
- $103,500 – Extend Support: Looking for a close below 106,500 is a first stage for establishing some measure of confidence that bears are gaining some traction. Should that happen, the extreme of the lower wick from October 10th will likely come into consideration as market participants turn down the time frames on their charts.
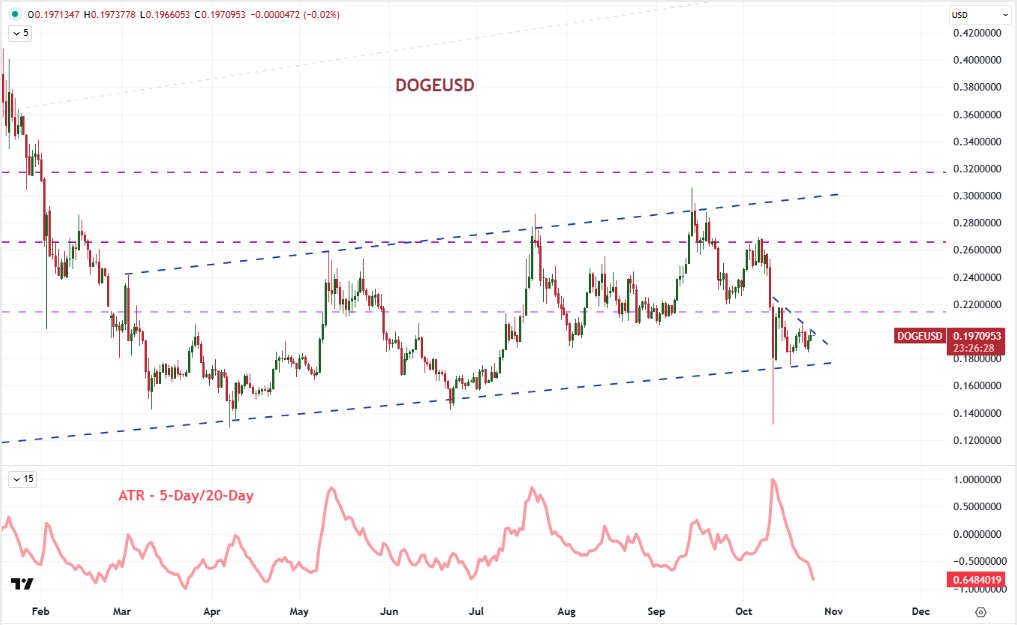
Chart of DOGEUSD with the 5-Day / 20-Day ATR Ratio (Daily)
Source: Data – StoneX, TradingView
While DOGEUSD has much the same general pattern that BTCUSD and other major cryptocurrencies are exhibiting on their daily charts, the picture is exaggerated in a few different qualities. First, the channel that has formed is more extended with trendline support stretching back through the past 13 months to offer up a more recognizable barrier should traders consider points of heavier conviction.
A second quality that is more exaggerated is the congestion that Doge has formed. The contrast of this past week’s activity to October 10th’s extreme move is particularly acute. Looking at it more quantitatively, there has been a marked downshift in activity when we compared the volatility of the past week to the month (using the 5-day to 20-day ATR). This coin has a history of returning to dramatic activity amid breakouts, and the reading’s comparable low to June 29th should draw our attention when put into context of the trend channel.
Key Levels:
- 0.2150 – Intermediate Resistance: While a break of the past two week’s congestion can happen much earlier than 0.2150, the propensity for volatility form this pair makes more proximate levels – like 0.2053 which is this past week’s swing high – less reliable as key technical boundaries that significant real shifts in conviction. There are overlapping Fibs at 0.2150 in contrast and a move to that level would likely carry more weight for bullish interest.
- 0.1700 – Key Support: As far as the longer-term rising trend channel is concerned, the floor on price stands roughly at 0.1700. That said, the volatility from earlier this month and intraday sheering through this boundary will raise some questions as to how definitive a breach would be treated. The October 10th candle’s intraday low is around 0.1313, which could play a role during fast moving markets but especially if we move upon it in a more measured pace after clearing the channel floor.
-- Written by: John Kicklighter, Global Head of Content