



Crude Oil Weekly Outlook: BRICS Summit Calls for Maximum Restraint
Crude Oil Weekly Outlook: BRICS Summit Calls for Maximum Restraint as the Energy Crisis Reaches Critical Economic Tipping Points
Share this:

The BRICS summit called for maximum restraint this weekend as the energy crisis reaches critical economic tipping points. Diplomacy was presented as the preferred path toward resolution rather than escalation, potentially supporting the latest pullback in crude oil prices.
This diplomatic narrative follows steep price surges across WTI, Brent and the energy sector ETF, including:
- WTI breaking above 7-month declining resistance near $94.
- Brent rallying toward its 7-month declining resistance near $108.
- The Energy Select Sector SPDR Fund (XLE) breaking above its 2008–2026 resistance.
These bullish setups reflected rising inflationary risks, while transportation disruptions also contributed to food-price inflation. The global food-price index has reached levels last seen in 2022.
The BRICS alliance was created in 2009 as a forum for major emerging economies seeking greater influence in institutions traditionally dominated by Western powers. Its members include the UAE, India, China and Russia, representing approximately 50% of the world’s population, 40% of global GDP and more than 25% of global trade.
In his opening remarks at the summit, Indian Prime Minister Narendra Modi stated: “We have to transform this pyramid of privilege into a platform of partnership.”
The statement reflects a shift toward resolution and cooperation rather than further escalation, which could help limit pressure on global economic growth and reduce the risk of disruptions to oil exports, shipping routes and energy flows through the Strait of Hormuz.
The summit does not guarantee an end to the war. At the same time, U.S. President Donald Trump has vowed to bring these risks to an end as the U.S. midterm elections approach, including by seeking an end to the conflict involving Iran and encouraging lower crude oil prices.
This remains speculative, but it shifts the narrative toward a potential resolution rather than continued escalation. The crude oil setups below could help determine whether that shift is confirmed by price action.
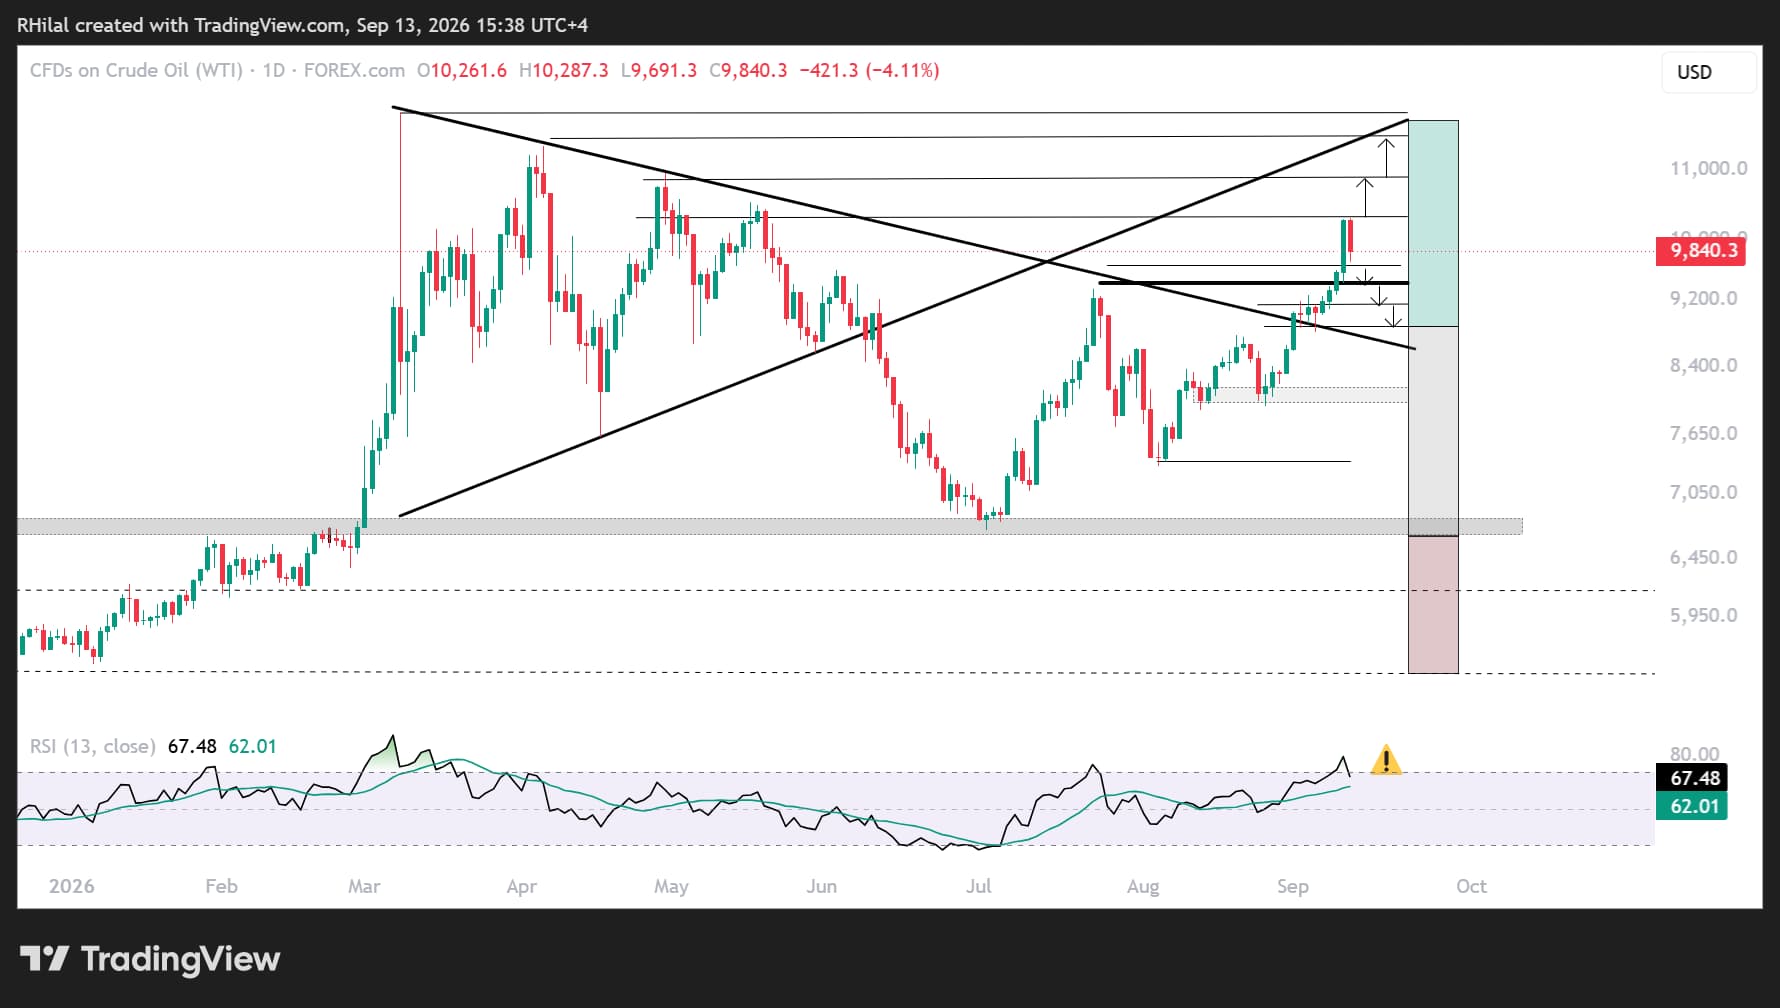
USOIL: Daily Time Frame — Log Scale
Source: TradingView
For WTI, the 7-month resistance level that has capped lower highs since March 2026 remains the main barometer for the bullish or bearish bias.
- The key support levels align with the July 2026 high near $94 and the September 4 low near $88.
- A breakdown below these levels could confirm a broader de-escalation narrative.
- The $88 area also aligns with the 61.8% Fibonacci retracement of the August 26–September 11 advance, making it another major confluence zone to monitor.
Bullish scenario: A daily close above $103 would redirect WTI toward $108, which also represents the 78.6% Fibonacci retracement of the March–July downtrend.
A sustained move above this area would reinforce the potential for another rally toward the yearly highs.
Overall, bullish risks remain elevated as long as crude oil prices hold above the July 2026 highs.
The current oil-market structure continues to interact with inflation data, Treasury yields and expectations for the Federal Reserve’s policy decision.
The broader risk-off narrative could begin to reverse if crude oil breaks below its key support levels, Treasury yields extend their pullback and geopolitical tensions begin to ease ahead of the U.S. midterm elections.
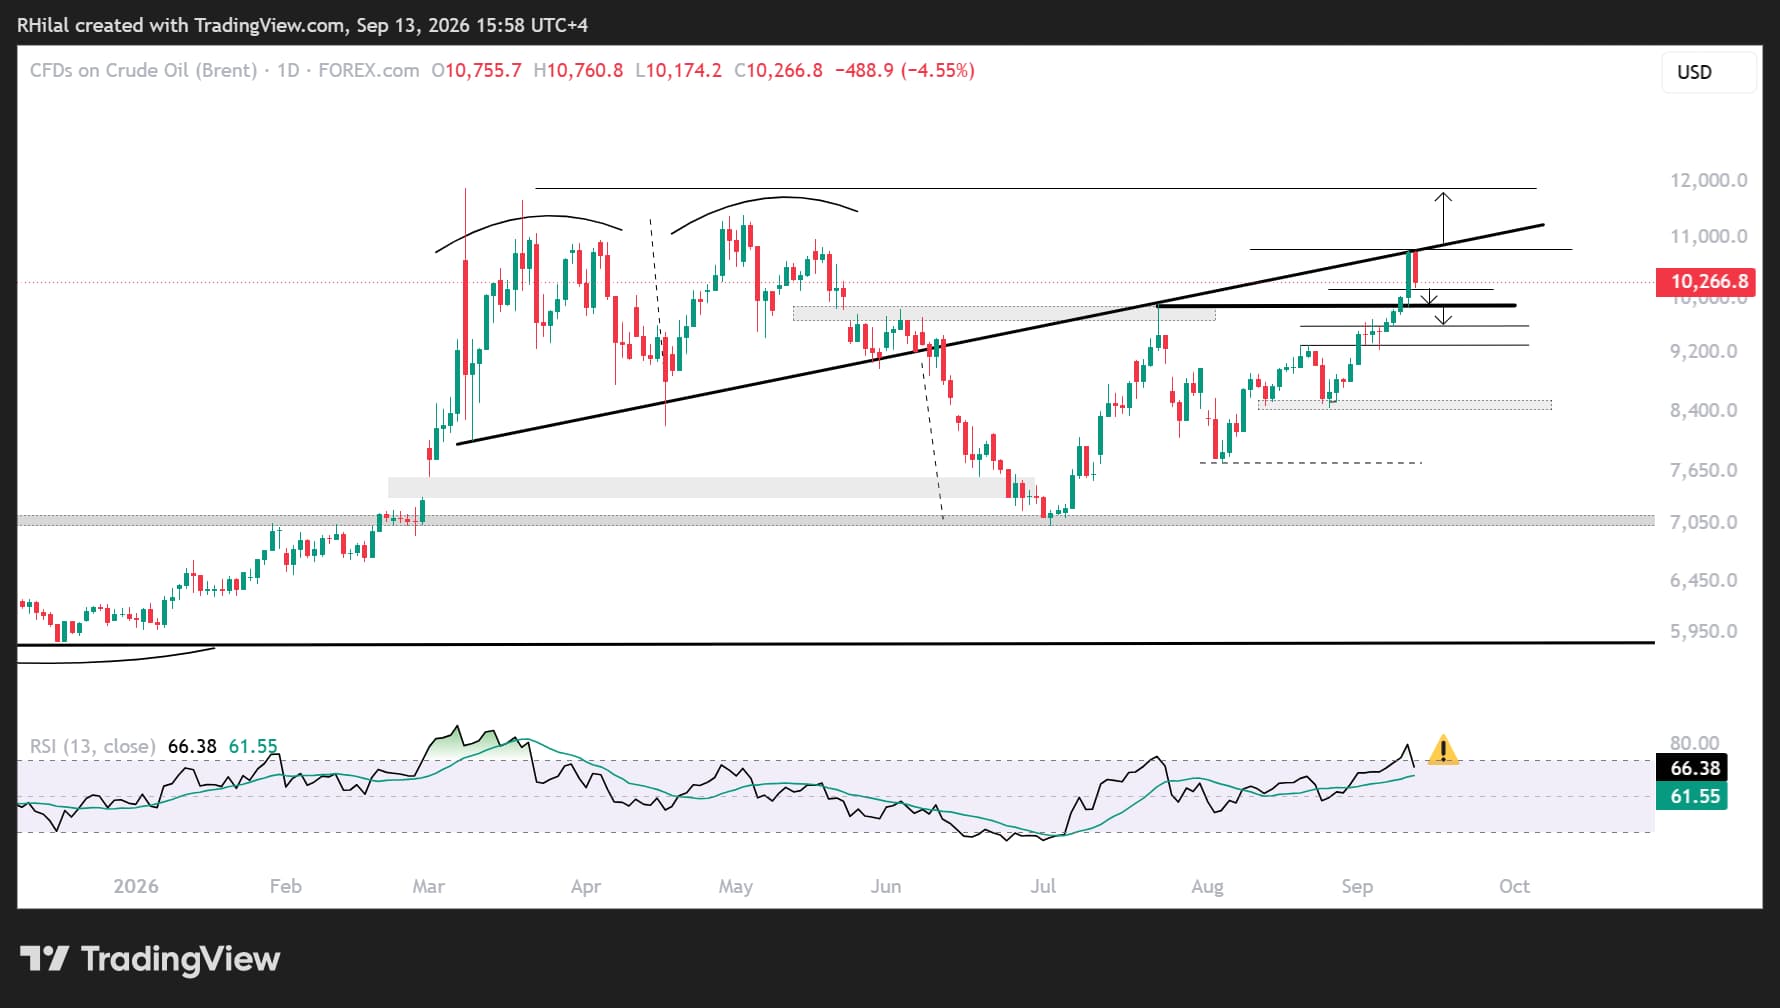
UKOIL: Daily Time Frame — Log Scale
Source: TradingView
For Brent crude, price action reached a major confluence zone, increasing the possibility that a short-term top may have formed.
The confluence zone includes:
- The 7-month trendline that served as support between March and June 2026 before turning into resistance between July and September 2026.
- The 78.6% Fibonacci retracement of the March–July 2026 downtrend near $108.
- Overbought momentum conditions last seen in March, close to the yearly highs.
The pullback was expected given the steepness of the rally and the importance of this confluence zone.
Bullish scenario: Reclaiming the $108 mark would restore the longer-term bullish outlook and reinforce inflationary and geopolitical escalation risks.
Such a move could redirect Brent toward the yearly highs.
Bearish scenario: A move back below 101.60 and the July 2026 high near $99 would support a short-term de-escalation narrative.
The next downside levels would be $95.70 and $93, corresponding to Fibonacci retracement levels of the advance between August 26 and September 11.
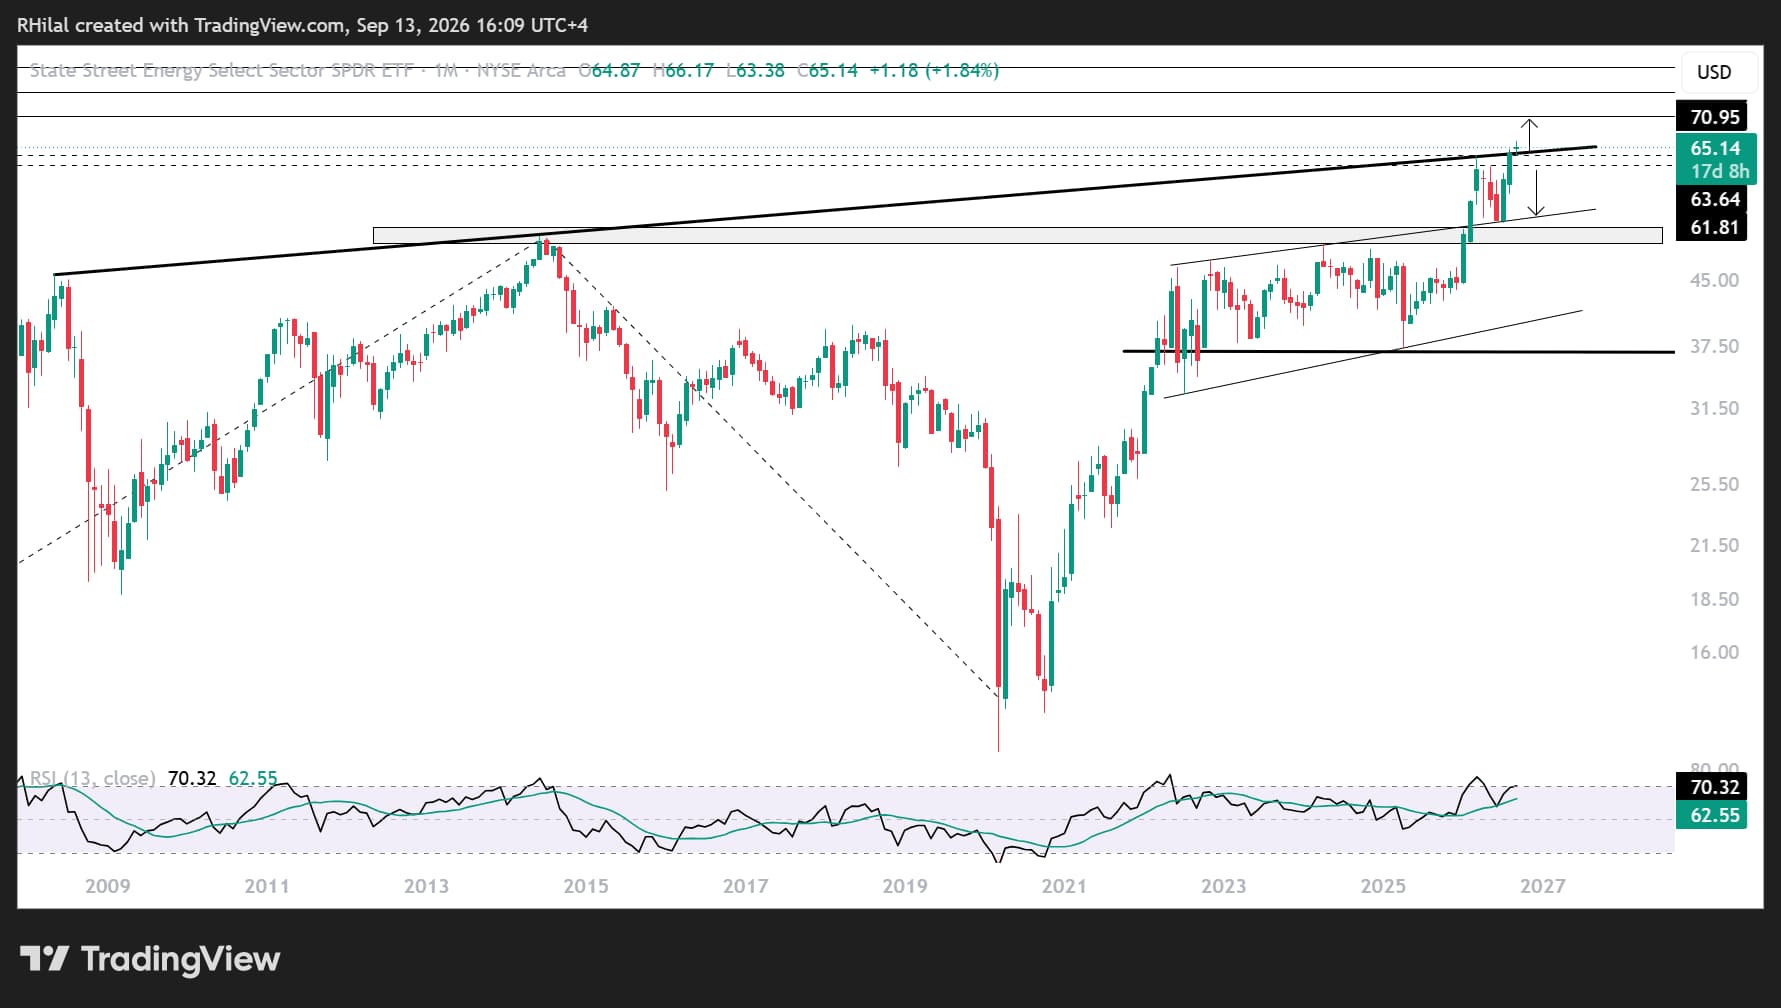
XLE: Monthly Time Frame — Log Scale
Source: TradingView
From an ETF perspective, XLE reflects the broader performance of the energy sector.
Price action broke above a major 2008–2026 resistance level, which turned into support in September 2026. For now, that support is holding above $63.50.
The price structure remains consistent with persistent geopolitical tensions and signals potential long-term stress across the energy market.
Bullish scenario: Holding above $63.50 and reclaiming the $65.50 area would reinforce the bullish forecast and open the door to new record highs.
Upside targets include the Fibonacci extension levels of the 2002–2014–2020 cycle near $68, $73 and $77.
This scenario would likely align with a broader escalation scenario.
Bearish scenario: A breakdown below the $61–$60 zone would reaffirm the strength of the multi-year resistance level and pressure XLE into another corrective cycle, targeting $58 and $51.
This scenario would likely align with broader de-escalation across geopolitical tensions.
Written by Razan Hilal, CMT
Follow on X: @Rh_waves
Latest market news



Open an account in minutes
Experience award-winning platforms with fast and secure execution.
Economic calendar
Web Trader platform
Our sophisticated web-based platform is packed with features.
Related articles
Gold Technical Outlook: XAU/USD Bulls Fight to Hold Breakout Support After 7% Rally 11 10 2026
Gold's sharp recovery has stalled beneath major resistance, with the next reaction likely to determine whether a larger bullish reversal can develop.

Bond yields and crude call the shots for ASX 200
The ASX 200 has rallied on 93% of occasions this year when Australian three-year bond yields have fallen at least five basis points. With crude prices also plunging, the latest breakout has history on its side.


Gold coils for potential breakout as US CPI looms
Gold's ascending triangle is putting $4,140 firmly in focus ahead of US CPI. With traditional macro relationships offering few clues, the price action may prove more useful for traders.
The information on this web site is not targeted at the general public of any particular country. It is not intended for distribution to residents in any country where such distribution or use would contravene any local law or regulatory requirement. The information and opinions in this report are for general information use only and are not intended as an offer or solicitation with respect to the purchase or sale of any currency or CFD contract. All opinions and information contained in this report are subject to change without notice. This report has been prepared without regard to the specific investment objectives, financial situation and needs of any particular recipient. Any references to historical price movements or levels is informational based on our analysis and we do not represent or warranty that any such movements or levels are likely to reoccur in the future. While the information contained herein was obtained from sources believed to be reliable, author does not guarantee its accuracy or completeness, nor does author assume any liability for any direct, indirect or consequential loss that may result from the reliance by any person upon any such information or opinions.
Futures, Options on Futures, Foreign Exchange and other leveraged products involves significant risk of loss and is not suitable for all investors. Losses can exceed your deposits. Increasing leverage increases risk. Spot Gold and Silver contracts are not subject to regulation under the U.S. Commodity Exchange Act. Contracts for Difference (CFDs) are not available for US residents. Before deciding to trade forex, commodity futures, or digital assets, you should carefully consider your financial objectives, level of experience and risk appetite. Any opinions, news, research, analyses, prices or other information contained herein is intended as general information about the subject matter covered and is provided with the understanding that we do not provide any investment, legal, or tax advice. You should consult with appropriate counsel or other advisors on all investment, legal, or tax matters. References to FOREX.com or GAIN Capital refer to StoneX Group Inc. and its subsidiaries. Please read Characteristics and Risks of Standardized Options.