



Crypto Forecast: Bitcoin Plunges 15% Off Monthly High- Key Support Under Pressure
Bitcoin has sold off sharply from recent highs with BTC/USD now testing major support. The reaction here may determine whether the decline deepens or stabilizes.
Share this:

Bitcoin Technical Forecast: BTC/USD Weekly & Daily Trade Levels
- Bitcoin has fallen more than 15% from the monthly high, with BTC/USD breaking below the November trendline.
- BTC/USD now testing key support near December low- reaction off this mark will be critical in determining whether the decline resumes or stabilizes into consolidation.
- Resistance eyed at the yearly open with a weekly close beneath support needed to fuel resumption of the broader downtrend.
Bitcoin is poised to mark a second-consecutive weekly decline with BTC/USD losses accelerating after breaking below the November uptrend. The selloff has carried price into major support near the December low, placing emphasis on how the market responds at this threshold. While the broader structure remains under pressure, the risk rises for inflection here and the reaction is likely to shape near-term direction for Bitcoin. Battle lines drawn on the BTC/USD technical charts.
Review my latest Weekly Strategy Webinar for an in-depth breakdown of this Bitcoin setup and more. Join live on Monday’s at 8:30am EST.
Bitcoin Price Chart – BTC/USD Weekly
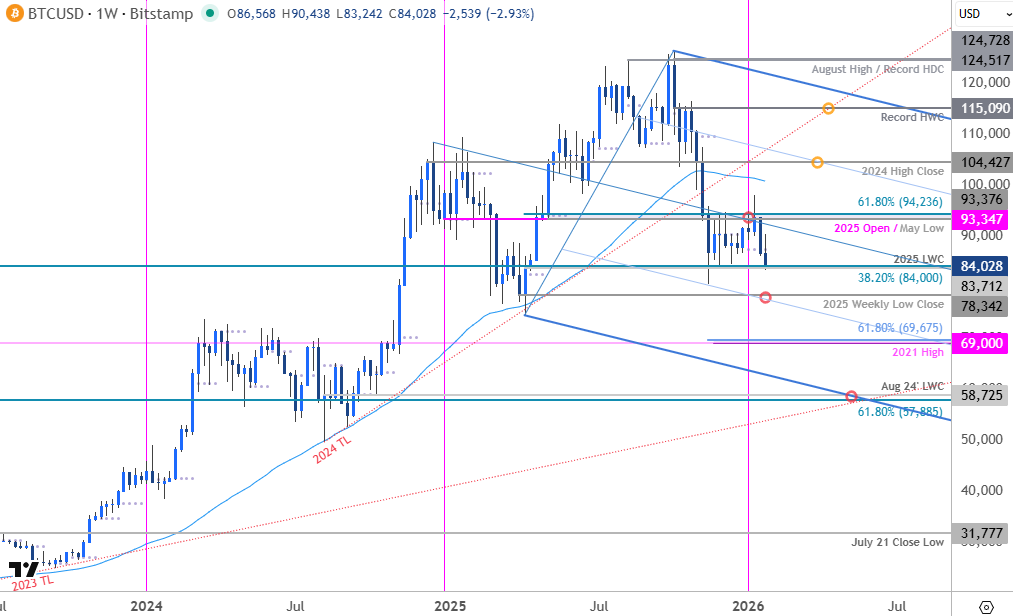
Chart Prepared by Michael Boutros, Sr. Technical Strategist; BTC/USD on TradingView
In my last Cryptocurrency Forecast we noted that Bitcoin was trading, “within the objective December opening-range and the focus remains on a breakout in the weeks ahead for guidance. From a trading standpoint, the bulls remain vulnerable while below 94,263 with a break below 83,712 needed to fuel the next major leg of the Bitcoin decline.” Despite a topside breach on January 13, the bulls were unable to secure a weekly close above lateral resistance at 93,347-94,236- a region defined by the objective 2025 yearly open, the May low, and the 61.8% retracement of the 2025 yearly range.
The subsequent reversal has now extended more than 15% off the monthly high with BTC/USD now testing key support at the 2025 low-week close (LWC), the December swing low and the 38.2% retracement of the 2022 advance at 83,712-84,00. Looking for a reaction off this mark in the days ahead with a weekly close below needed to mark resumption of the October downtrend.

Bitcoin Price Chart – BTC/USD Daily
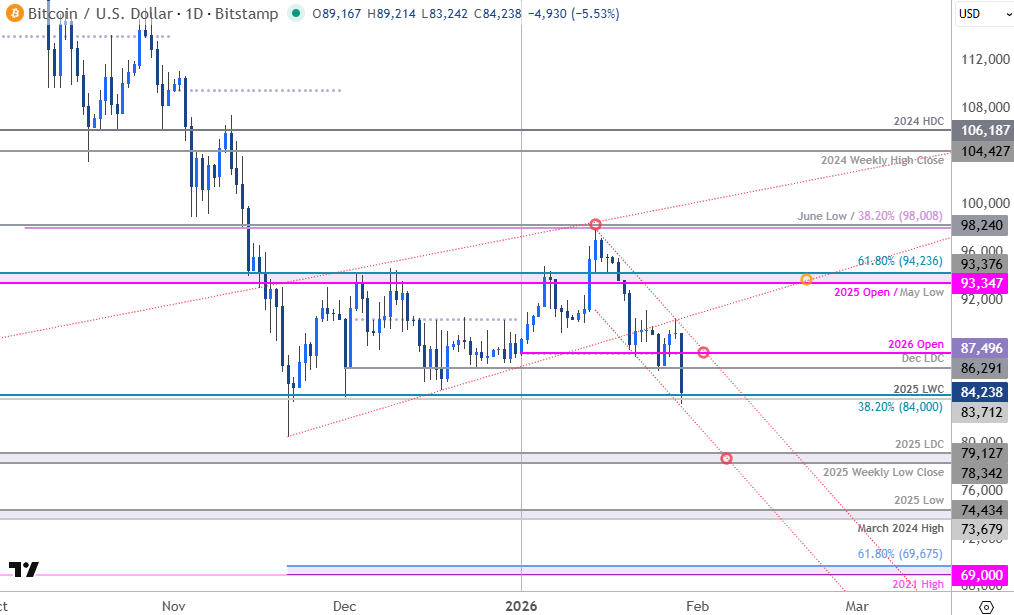
Chart Prepared by Michael Boutros, Sr. Technical Strategist; BTC/USD on TradingView
A closer look at the Bitcoin daily chart shows BTC/USD breaking below the November trendline last week with multiple tests of this slope as resistance keeping the bears in control. A channel extending off the monthly highs is guiding the most recent decline with the lower parallel further highlighting near-term support here at 83,712-84,000.
Initial resistance is eyed with the December low-day close (LDC) at 86,291 and is backed closely by the objective yearly open at 87,496. A topside breach / daily close above this threshold is needed to suggest a more significant low is in place and a larger recovery is underway. Subsequent resistance is eyed back at 93,347-94,236 and 98,008/240- a region defined by the 38.2% retracement of the October decline and the June swing low. Strength surpassing this zone is ultimately needed to put the bulls back in control here.
A break below this key pivot zone would expose the 2025 weekly low close and the 2025 low-day close (LDC) at 78,342-79,127. Note that channel support converges on this threshold next week. Subsequent support objectives are eyed at the March 2024 high and the 2025 swing low at 73,679-74,434 followed by 69,000/675- a region defined by the 2021 swing high and the 61.8% extension of the October decline. Both these zones represent areas of interest for possible downside exhaustion / price inflection IF reached.
Bottom line: Bitcoin is testing big support here and losses below this level would threaten resumption of the multi-month downtrend in BTC/USD. From a trading standpoint, rallies should be limited to 87,496 IF price is heading lower on this stretch with a close below 83,712 still needed to fuel the next major leg of the decline.
Active Weekly Technical Charts
- Canadian Dollar (USD/CAD)
- Australian Dollar (AUD/USD)
- S&P 500, Nasdaq, Dow
- British Pound (GBP/USD)
- Swiss Franc (USD/CHF)
- US Dollar Index (DXY)
- Gold (XAU/USD)
- Crude Oil (WTI)
- Euro (EUR/USD)
- Japanese Yen (USD/JPY)
--- Written by Michael Boutros, Senior Technical Strategist
Follow Michael on X @MBForex
Latest market news




Open an account in minutes
Experience award-winning platforms with fast and secure execution.
Economic calendar
Web Trader platform
Our sophisticated web-based platform is packed with features.
Related articles
Nvidia Earnings Preview: NVDA’s First Test of the Post Jenson Huang Era
Nvidia is expected to report $2.47 in EPS on $108.8B in revenue this quarter, but investors will be more interested in the company's guidance after the unexpected departure of founder and CEO Jenson Huang.

Swiss Franc Forecast: USD/CHF 3% Rally Threatens Multi-Year Downtrend 11 13 2026
USD/CHF has erased its October losses, but bulls still need a decisive weekly close above key resistance to confirm a larger bullish reversal.

Bitcoin, Gold Outlook: Bullish Hold or Bearish Shift?
Bitcoin, Gold Outlook: The dollar’s surge to new 2026 highs and approach toward nine-month resistance are raising near-term reversal risks across precious metals and currency markets. This follows recent declines that pushed Bitcoin below $70,000 and gold below $3,870.

The information on this web site is not targeted at the general public of any particular country. It is not intended for distribution to residents in any country where such distribution or use would contravene any local law or regulatory requirement. The information and opinions in this report are for general information use only and are not intended as an offer or solicitation with respect to the purchase or sale of any currency or CFD contract. All opinions and information contained in this report are subject to change without notice. This report has been prepared without regard to the specific investment objectives, financial situation and needs of any particular recipient. Any references to historical price movements or levels is informational based on our analysis and we do not represent or warranty that any such movements or levels are likely to reoccur in the future. While the information contained herein was obtained from sources believed to be reliable, author does not guarantee its accuracy or completeness, nor does author assume any liability for any direct, indirect or consequential loss that may result from the reliance by any person upon any such information or opinions.
Futures, Options on Futures, Foreign Exchange and other leveraged products involves significant risk of loss and is not suitable for all investors. Losses can exceed your deposits. Increasing leverage increases risk. Spot Gold and Silver contracts are not subject to regulation under the U.S. Commodity Exchange Act. Contracts for Difference (CFDs) are not available for US residents. Before deciding to trade forex, commodity futures, or digital assets, you should carefully consider your financial objectives, level of experience and risk appetite. Any opinions, news, research, analyses, prices or other information contained herein is intended as general information about the subject matter covered and is provided with the understanding that we do not provide any investment, legal, or tax advice. You should consult with appropriate counsel or other advisors on all investment, legal, or tax matters. References to FOREX.com or GAIN Capital refer to StoneX Group Inc. and its subsidiaries. Please read Characteristics and Risks of Standardized Options.