



2 ways to use correlations to help trade
Traders should look for readings below -0.80 or above +0.80 for the correlation coefficient to be considered significant
Share this:
When traders refer to looking at a correlation between to assets, they are often referring to the correlation coefficient, which is a statistical measure of the strength of the relationship between the relative movement of 2 variables, according to Investopedia. The two are terms are often used interchangeably. The strength of the relationship ranges from -1.00 to +1.00. A reading of -1.00 means that there is a perfect negative correlation between the 2 assets. They move in the opposite direction relative to each other 100% of the time. A reading of +1.00 means that there is a perfect positive correlation between the 2 assets. They move in the same direction relative to each other 100% of the time. A reading of 0.00 means that there is no correlation between the 2 assets. For the correlation coefficient to be significant, traders should look for readings below -0.80 or above +0.80.
Why do traders use correlations?
Traders look at correlations for 2 reasons:
- To compare an asset to a benchmark
- To look for opportunities for diversify
Using correlation to compare an asset to a benchmark
Traders may wish to buy an asset they may not have access to. One-way traders can use a correlation coefficient is to look for a high positive or negative correlation between an asset they want to own and the asset they can own and use the former one as a proxy. For example, many foreign exchange traders don’t have access to the US Dollar Index (DXY). Therefore, traders can look for an asset with a strong correlation coefficient to the DXY, such as EUR/USD and trade that instead.
Trade EUR/USD now: Login or Open a new account!
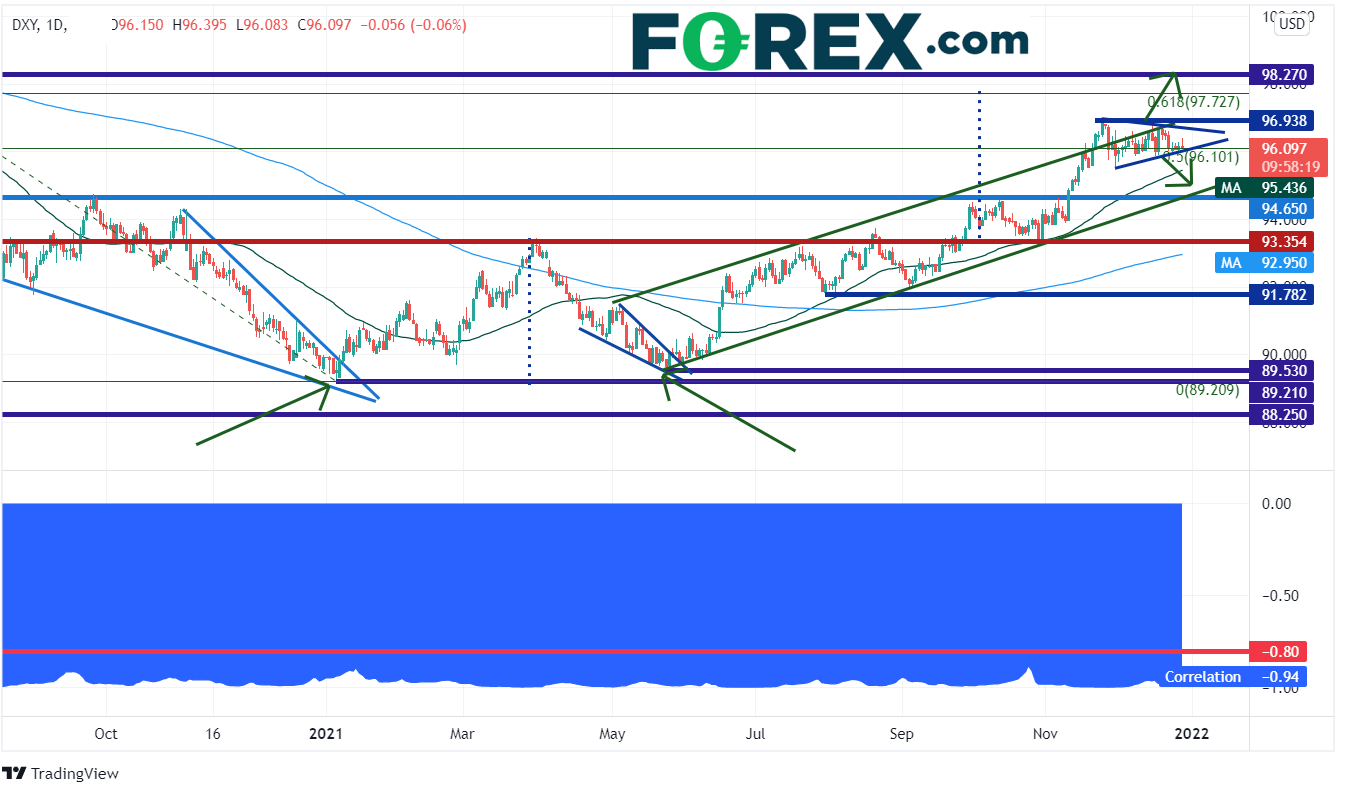
On the bottom of the DXY chart below is the correlation coefficient between DXY and EUR/USD. The current reading is -0.94 on a daily timeframe. This is considered a strong, negative correlation. Therefore, because the correlation is negative, if one wants to own DXY, that traders can just sell EUR/USD (buy US Dollars).
Source: Tradingview, Stone X
Using correlations to look for opportunities to diversify
A trader may be holding an asset which may seem risky for him or her to hold onto. Therefore, that person may wish to diversity, or hedge, against that asset. For example, a trader sees a great opportunity for own Crude Oil but may wish to diversity the asset in his or her portfolio. Crude Oil and the Norwegian Krone have a strong negative correlation. Therefore, the trader can buy both Crude Oil and USD/NOK (sell NOK) to help take away some of the risk of owning Crude oil.
Trade USD/NOK now: Login or Open a new account!
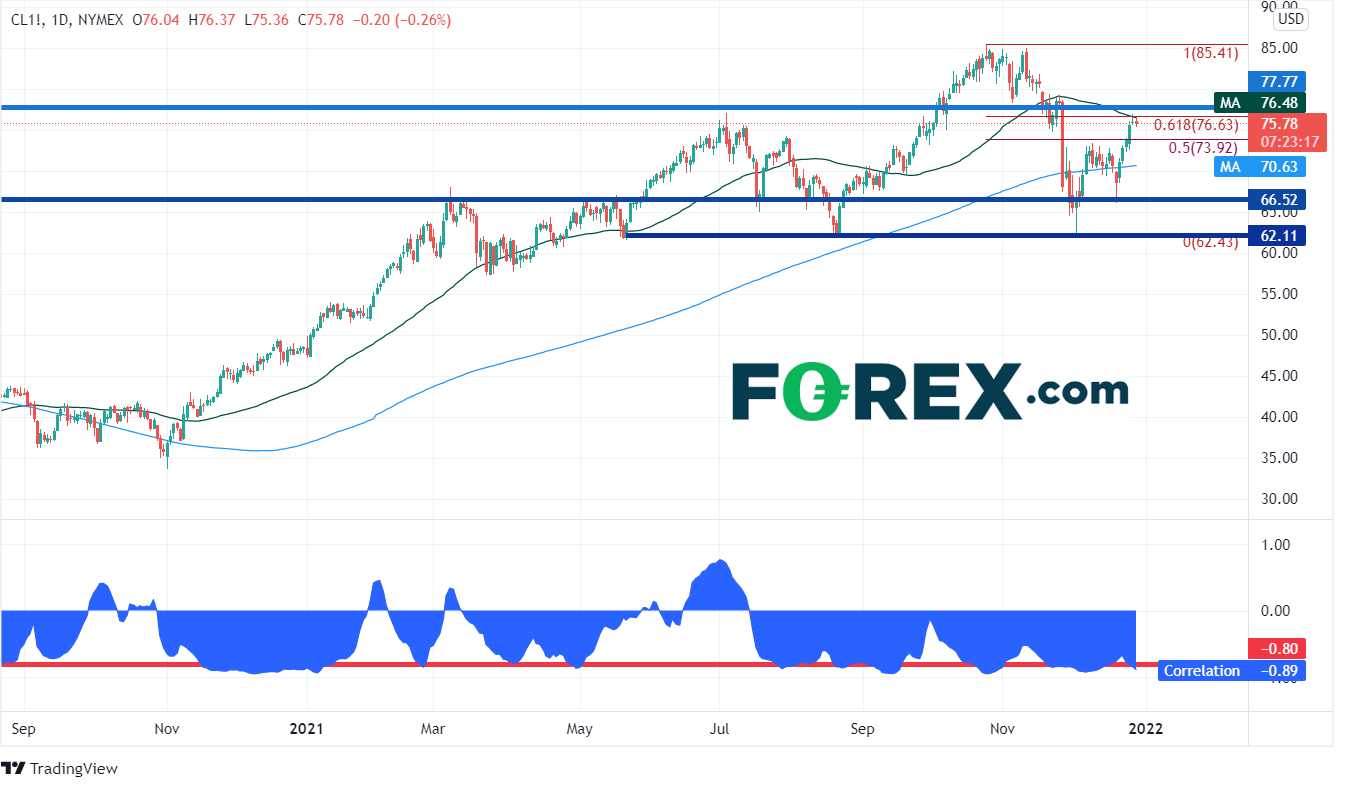
On the bottom of the WTI oil chart below is the correlation between the continuous Crude Oil futures contract and USD/NOK. The current reading is -0.89 on a daily timeframe. This is considered a strong, negative reading. If one wants to diversify the crude oil holdings, he or she can just buy USD/NOK.
Source: Tradingview, Stone X
One thing that is important to note about correlations is that they fall in and out of favor. Traders should be aware of when the correlation coefficient moves above -0.80 or below +0.80, as the reading would not be considered a useful tool to help them trade.
Correlations can be useful tools for help in trading if used correctly. Traders should look for readings below -0.80 or above +0.80 for the correlation coefficient to be considered significant.
Learn more about forex trading opportunities.
Related tags:
Latest market news




Open an account in minutes
Experience award-winning platforms with fast and secure execution, and enjoy tight spreads from 0.5 pts on FX and 0.3 pts on indices.
Economic calendar
Web Trader platform
Our sophisticated web-based platform is packed with features.
Related articles
Japanese Yen Forecast: USD/JPY 4% Rally Challenges Post-Intervention Downtrend 9 24 2026
USD/JPY momentum has shifted sharply higher, putting a major resistance confluence in focus as U.S. and Japanese event risk builds.

Oil Quietly Hands the Fed a Reason to Stay Hawkish
Oil prices and the U.S. dollar are both on the front foot as elevated energy costs feed Fed warnings that inflation may prove sticky.

S&P 500 forecast: Stocks extend drop as correction risks grow
US and global equity markets have extended Wednesday’s sell-off, with Wall Street opening lower after a weak handover from Asia and Europe. The deterioration in risk appetite has been spreading across global markets. The dollar was firmer, Treasury yields were holding onto yesterday’s gains, while gold, silver and bitcoin were all under pressure alongside equities and major currencies.
This report is intended for general circulation only. It should not be construed as a recommendation, or an offer (or solicitation of an offer) to buy or sell any financial products. The information provided does not take into account your specific investment objectives, financial situation or particular needs. Before you act on any recommendation that may be contained in this report, independent advice ought to be sought from a financial adviser regarding the suitability of the investment product, taking into account your specific investment objectives, financial situation or particular needs.
StoneX Financial Pte. Ltd., may distribute reports produced by its respective foreign entities or affiliates within the StoneX group of companies or third parties pursuant to an arrangement under Regulation 32C of the Financial Advisers Regulations. Where the report is distributed to a person in Singapore who is not an accredited investor, expert investor or an institutional investor (as defined in the Securities Futures Act), StoneX Financial Pte. Ltd. accepts legal responsibility to such persons for the contents of the report only to the extent required by law. Singapore recipients should contact StoneX Financial Pte. Ltd. at 6826 9988 for matters arising from, or in connection with the report.
In the case of all other recipients of this report, to the extent permitted by applicable laws and regulations neither StoneX Financial Pte. Ltd. nor its associated companies will be responsible or liable for any loss or damage incurred arising out of, or in connection with, any use of the information contained in this report and all such liability is hereby expressly disclaimed. No representation or warranty is made, express or implied, that the content of this report is complete or accurate.
StoneX Financial Pte. Ltd. is not under any obligation to update this report.
Trading CFDs carries a high level of risk that may not be suitable for some investors. Consider your investment objectives, level of experience, financial resources, risk appetite and other relevant circumstances carefully. The possibility exists that you could lose some or all of your investments, including your initial deposits. If in doubt, please seek independent expert advice. Visit www.forex.com/en-sg/terms-and-policies for the complete Risk Disclosure Statement.