









Asian Open Dollar Dominates and Equities Fall on Hawkish Fed
Well, the Fed didn’t wait for the Jackson hole symposium to turn hawkish (from a very dovish base), sending equities, commodities lower and the US dollars higher.
Share this:
The S&P 500 and Nasdaq 100 are on track to close lower for a third week, a bearish sequence not seen since July. I suspect the selloff is reaching a near-term exhaustion point, given both indices are now trading back above their 50-week EMAs.
And as their 3-week selloffs began with a lower could suggest that they’re in no hurry to reach a new record high in the near term. Even if history stacks the odds of new record highs heavily in their favour further out. Furthermore, market positioning of the Nasdaq 100 and S&P 500 futures markets show that bets against it are on the rise, which bolsters my case that any incoming bounce could be short lived.
Nasdaq 100 Futures (NQ) Market Positioning – COT report
I am seeing mixed signals between large speculators and asset managers. I generally find the latter to be better at tracking the direction of indices, so more weigh shall given to this subset of trader. Asset managers increased their gross-short exposure to a near 2-year high last week and trimmed longs, which dragged net-long exposure down to a 23-week low. Yet large speculators trimmed both longs and shorts. For this reason, my expectation is for the Nasdaq to trade lower in a few weeks from now, but price action also suggests a bounce could be due first.
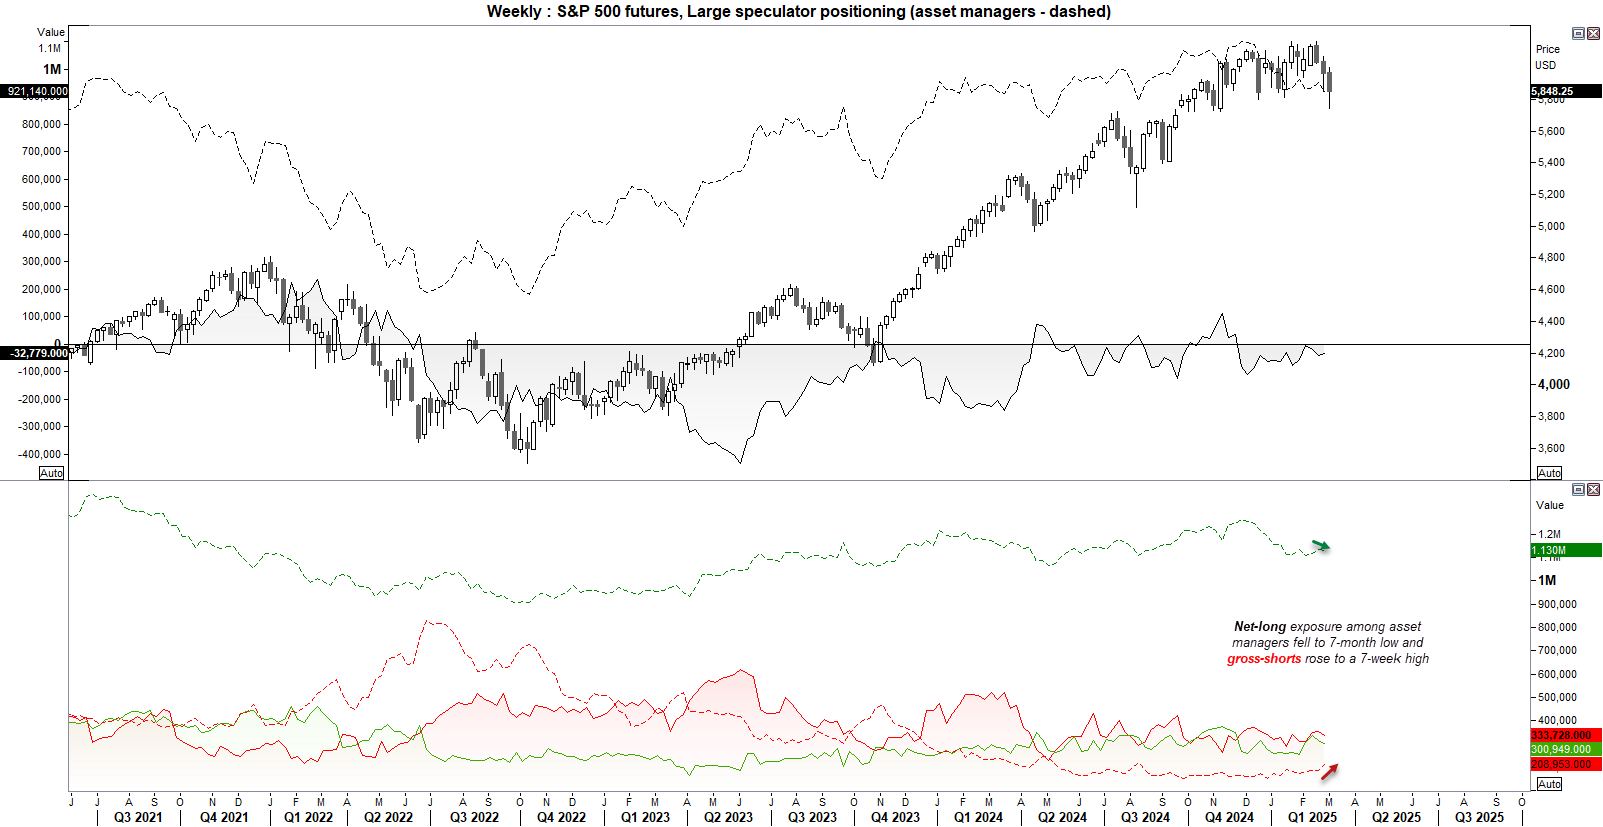
S&P 500 Futures (ES) Market Positioning – COT Report
Again, we’re seeing net-long exposure fall on the S&P 500 among asset managers, although net-short exposure has declined among large speculators. But as the latter group saw a reduction of longs and shorts, their bullish case is far from compelling.
Meanwhile, asset managers have increased their gross-short exposure to S&P 500 futures to a 7-month high and trimmed longs. And this suggests the same as above; any bounce could be short lived and a break to a new record high is not currently favoured.
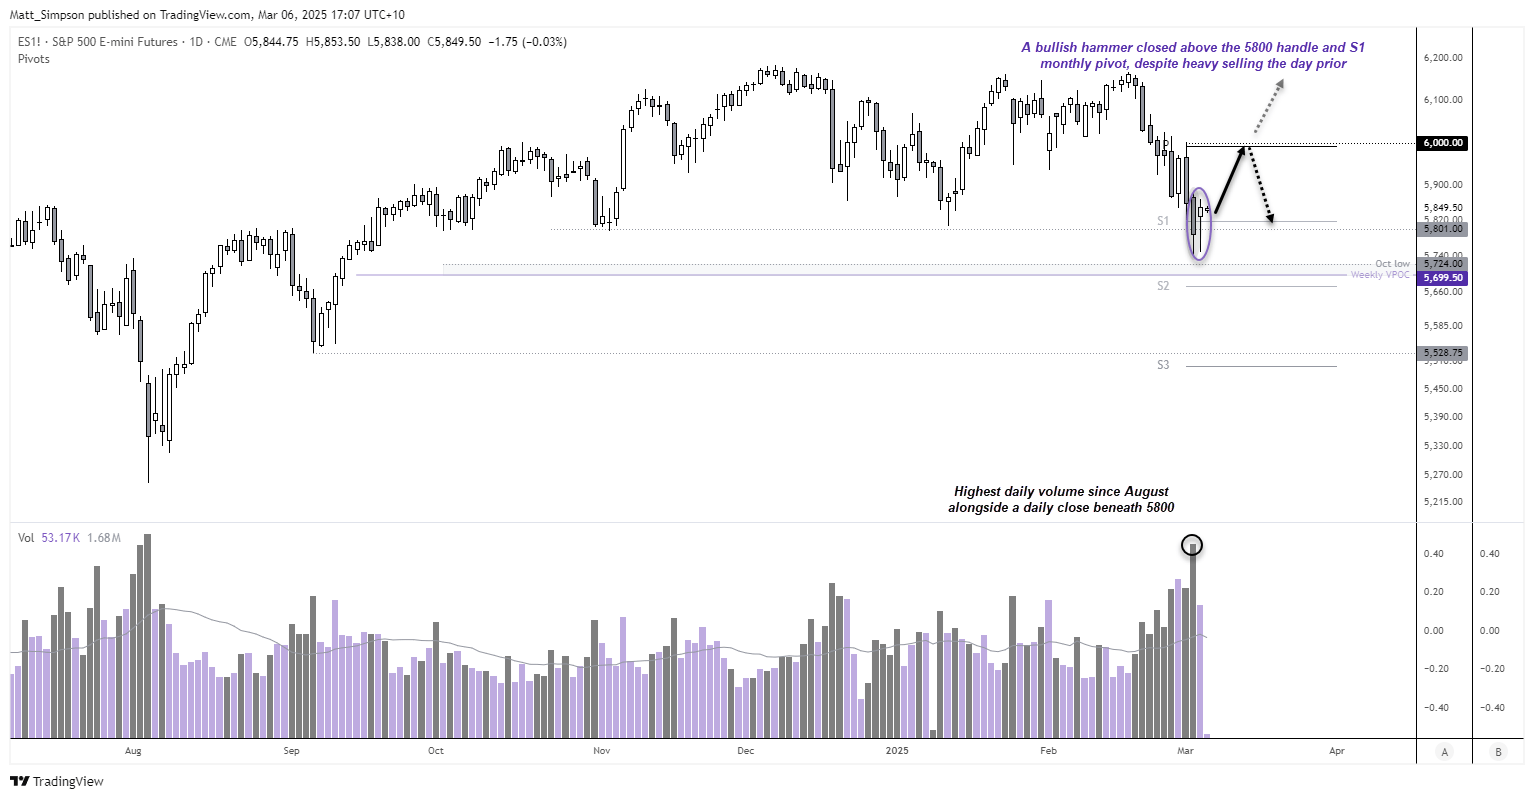
S&P 500 futures technical analysis
A daily close beneath the November low and 5800 level was accompanied by the heaviest daily volumes since August. While this shows bears clearly dominated the session, they must be disappointed with Wednesday’s bullish hammer, which was also a small bullish inside day which close back above 5800 and the monthly S1 pivot.
The bias is to seek dips within yesterday’s range while prices hold above Tuesday’s low, in anticipation of a move towards 6,00 near the monthly pivot point.
I can reassess sentiment if this plays out, but for now the bias is for a bounce to occur ahead of its next leg lower.
Nasdaq 100 futures technical analysis
It could argued that price action on Nasdaq futures are marginally more bullish than those seen on the S&p 500. While both formed a bullish hammer on Wednesday, the Nasdaq printed a doji instead of a decisively bearish bar with a daily close beneath key resistance. The doji also found support at the monthly S1 pivot, just above a weekly VPOC (volume point of control) and 20k handle.
Like the S&P 500, the bias is for a bounce towards the monthly pivot ahead of its next leg lower.
-- Written by Matt Simpson
Follow Matt on Twitter @cLeverEdge
How to trade with City Index
You can trade with City Index by following these four easy steps:
- Open an account, or log in if you’re already a customer
• Open an account in the UK
• Open an account in Australia
• Open an account in Singapore
- Search for the market you want to trade in our award-winning platform
- Choose your position and size, and your stop and limit levels
- Place the trade
Related tags:

Open an account in minutes
Experience award-winning platforms with fast and secure execution, and enjoy tight spreads from 0.5 pts on FX and 0.3 pts on indices.
Economic calendar
Web Trader platform
Our sophisticated web-based platform is packed with features.
Related articles

Dow Jones forecast: Stock markets under pressure from multiple sources
When looking at the major tech-heavy US indices like the S&P 500 or the Nasdaq 100, you wouldn’t think that the stock market is particularly weak. Yet, beneath the surface, the market is far from healthy right now. Investors are evidently just piling into the big tech and AI names, and as a result, market breadth is deteriorating. Other indices like the small cap Russell 2000 and the Dow Jones are starting to reflect that weakness.


Tankan Backs BOJ Tightening, but Yen Rate Expectations Ease
Japan’s Tankan supports further BOJ tightening, although softer rate expectations could limit support for the Japanese yen.


Nikkei breakout accelerates as yen weakness returns
Nikkei has started October with a powerful breakout, helped by renewed yen weakness and strong upside momentum

This report is intended for general circulation only. It should not be construed as a recommendation, or an offer (or solicitation of an offer) to buy or sell any financial products. The information provided does not take into account your specific investment objectives, financial situation or particular needs. Before you act on any recommendation that may be contained in this report, independent advice ought to be sought from a financial adviser regarding the suitability of the investment product, taking into account your specific investment objectives, financial situation or particular needs.
StoneX Financial Pte. Ltd., may distribute reports produced by its respective foreign entities or affiliates within the StoneX group of companies or third parties pursuant to an arrangement under Regulation 32C of the Financial Advisers Regulations. Where the report is distributed to a person in Singapore who is not an accredited investor, expert investor or an institutional investor (as defined in the Securities Futures Act), StoneX Financial Pte. Ltd. accepts legal responsibility to such persons for the contents of the report only to the extent required by law. Singapore recipients should contact StoneX Financial Pte. Ltd. at 6826 9988 for matters arising from, or in connection with the report.
In the case of all other recipients of this report, to the extent permitted by applicable laws and regulations neither StoneX Financial Pte. Ltd. nor its associated companies will be responsible or liable for any loss or damage incurred arising out of, or in connection with, any use of the information contained in this report and all such liability is hereby expressly disclaimed. No representation or warranty is made, express or implied, that the content of this report is complete or accurate.
StoneX Financial Pte. Ltd. is not under any obligation to update this report.
Trading CFDs carries a high level of risk that may not be suitable for some investors. Consider your investment objectives, level of experience, financial resources, risk appetite and other relevant circumstances carefully. The possibility exists that you could lose some or all of your investments, including your initial deposits. If in doubt, please seek independent expert advice. Visit www.forex.com/en-sg/terms-and-policies for the complete Risk Disclosure Statement.