








AUD/USD, Bitcoin analysis: A rebound for risk does not equate to risk on
Risk assets may be on the rise, but it is more due to a pause in risk off as opposed to buyers rushing back in. Still, it could still allow for some bullish wriggle room on AUD/USD and bitcoin if sentiment allows.
Share this:

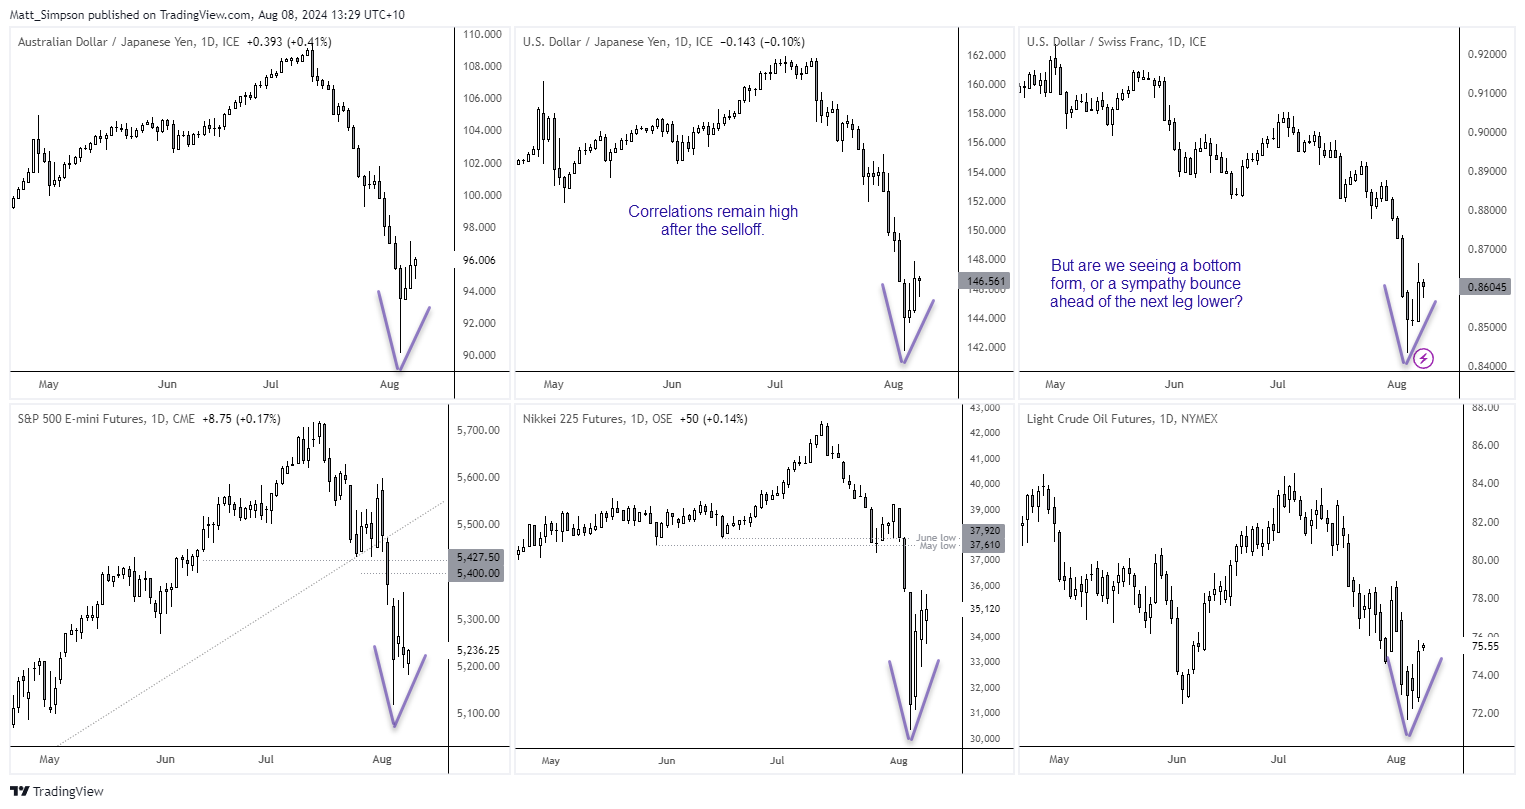
Looking across major indices and forex pairs, all I see is the same setup. A sudden drop of risk assets, with cautions gains now lifting them from their lows. Comments from Fed members have soothed fears of an emergency rate cut, lifting US yields to allows index futures to track them higher. The BOJ also surprised by shifting back to a dovish tone due to this week’s market turbulence, which is weakening the yen and reviving the carry trade. AUD/JPY rose over 7% from Monday’s low to Wednesday’s high and Nikkei futures rose over 18% over the same period.
But does that mean we’re back in a phase of risk on? Not necessarily. But unless we get another trigger to send yields and therefor risk assets lower, it leaves wriggle room for gains on otherwise battered markets. But the key point is that appetite for risk (or lack thereof) remains the bigger driver for markets at the moment.
Hawkish comments from RBA Bullock lift AUD/USD (a little)
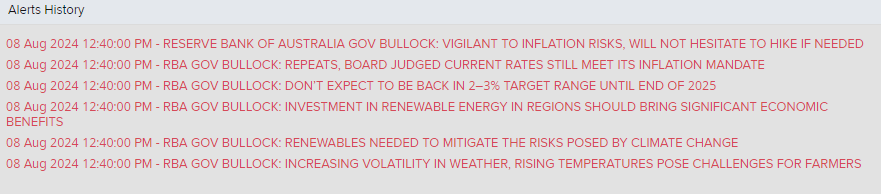
The Australian dollar is getting a tailwind from hawkish comments from RBA governor Bullock, who said the central banks “will not hesitate to hike if needed”. The RBA retained their hawkish bias despite softer inflation on the basis it remains “too high”, and bullock added today that she does not expect inflation to dip within their 1-3% target until the end of 2025. So we know that rate cuts are off the table, but I remain sceptical that the RBA will hike rates again with such a dovish Fed and RBNZ taken into consideration. Still, AUD/USD rose a further +25 pip after the comments, taking the day’s gains to 0.45% higher. Although resistance looms overhead.
AUD/USD technical analysis:
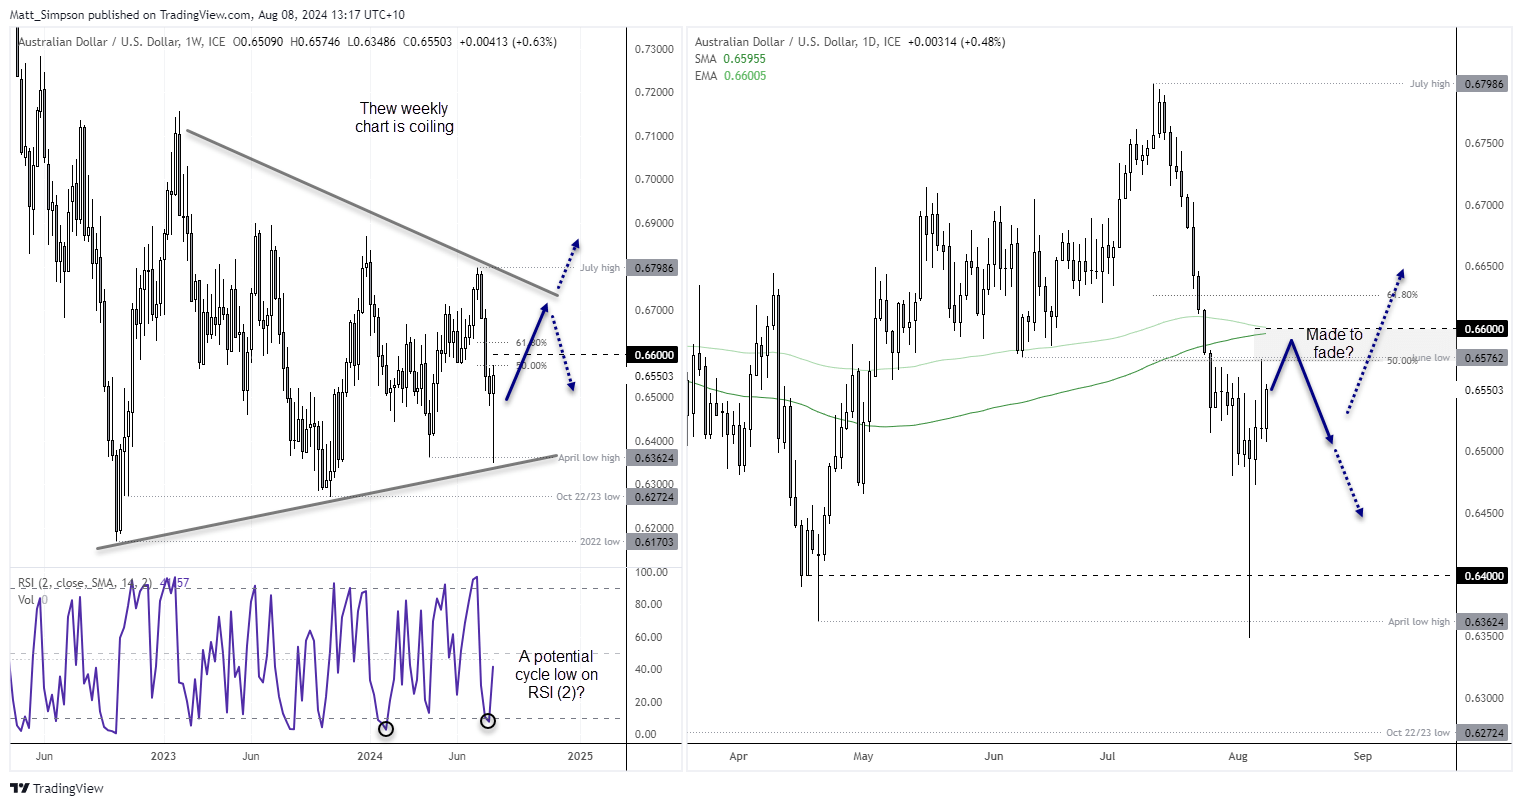
The weekly chart has caught my eye due to the large coiling pattern. AUD/USD could carve out a bullish pinbar if it is to close the week around current levels, which would follow on from last week’s RSI (2) oversold print. Should appetite for risk return, perhaps AUD/USD could make a break for 67c or the upper bounds of the coiling pattern.
Yet the daily chart needs to clear some resistance around 66c first, which includes the 200-day MA and EMA. Also note that a 50% retracement level sits near the June low (and Wednesday’s high). So for now my bias is to fade into move towards the 0.6575 – 0.6600 zone for another dip lower (open target). But for AUD/USD to stand any chance of a decent rally, US economic data needs to weaken to reinforce dovish-Fed bets, but to to the degree it ruins the chances of a Wall Street rally.
Bitcoin futures technical analysis:
Price action since the all-time high set in March appears to be corrective. The swings are volatile, frequent and overlap quite a bit, which is a clear change in character from the almost parabolic move into the record high. But that also suggests it could go on to a new record high in due course, we’re just not sure if the corrective low has been seen yet. However, a case for base is building.
This week’s low almost perfectly respected the 50% retracement level between the November low to ATH. And if it closes the week around current levels, a bullish pinbar will form and mark a false break of the January high and May low. And any moves towards the 54k area could temp bulls to load up – assuming sentiment allows. At a minimum, a move back to close the weekend gap just below $64k could be on the cards.
However, take note that the 200-day MA and EMA sit overhead and nearby at 58,159 and 58,239 respectively. A break above them is therefore required before assuming a move for $64k, along with a broader risk-on rally. Low volatility dips towards the May and Jan lows could entice dip buyers, although a break beneath them (alongside a broader risk-off rally) invalidates the near-term bullish bias.
-- Written by Matt Simpson
Follow Matt on Twitter @cLeverEdge
How to trade with City Index
You can trade with City Index by following these four easy steps:
- Open an account, or log in if you’re already a customer
• Open an account in the UK
• Open an account in Australia
• Open an account in Singapore
- Search for the market you want to trade in our award-winning platform
- Choose your position and size, and your stop and limit levels
- Place the trade

Open an account in minutes
Experience award-winning platforms with fast and secure execution, and enjoy tight spreads from 0.5 pts on FX and 0.3 pts on indices.
Economic calendar
Web Trader platform
Our sophisticated web-based platform is packed with features.
Related articles
Japanese Yen Forecast: USD/JPY 4% Rally Challenges Post-Intervention Downtrend 9 24 2026
USD/JPY momentum has shifted sharply higher, putting a major resistance confluence in focus as U.S. and Japanese event risk builds.

Oil Quietly Hands the Fed a Reason to Stay Hawkish
Oil prices and the U.S. dollar are both on the front foot as elevated energy costs feed Fed warnings that inflation may prove sticky.


S&P 500 forecast: Stocks extend drop as correction risks grow
US and global equity markets have extended Wednesday’s sell-off, with Wall Street opening lower after a weak handover from Asia and Europe. The deterioration in risk appetite has been spreading across global markets. The dollar was firmer, Treasury yields were holding onto yesterday’s gains, while gold, silver and bitcoin were all under pressure alongside equities and major currencies.
This report is intended for general circulation only. It should not be construed as a recommendation, or an offer (or solicitation of an offer) to buy or sell any financial products. The information provided does not take into account your specific investment objectives, financial situation or particular needs. Before you act on any recommendation that may be contained in this report, independent advice ought to be sought from a financial adviser regarding the suitability of the investment product, taking into account your specific investment objectives, financial situation or particular needs.
StoneX Financial Pte. Ltd., may distribute reports produced by its respective foreign entities or affiliates within the StoneX group of companies or third parties pursuant to an arrangement under Regulation 32C of the Financial Advisers Regulations. Where the report is distributed to a person in Singapore who is not an accredited investor, expert investor or an institutional investor (as defined in the Securities Futures Act), StoneX Financial Pte. Ltd. accepts legal responsibility to such persons for the contents of the report only to the extent required by law. Singapore recipients should contact StoneX Financial Pte. Ltd. at 6826 9988 for matters arising from, or in connection with the report.
In the case of all other recipients of this report, to the extent permitted by applicable laws and regulations neither StoneX Financial Pte. Ltd. nor its associated companies will be responsible or liable for any loss or damage incurred arising out of, or in connection with, any use of the information contained in this report and all such liability is hereby expressly disclaimed. No representation or warranty is made, express or implied, that the content of this report is complete or accurate.
StoneX Financial Pte. Ltd. is not under any obligation to update this report.
Trading CFDs carries a high level of risk that may not be suitable for some investors. Consider your investment objectives, level of experience, financial resources, risk appetite and other relevant circumstances carefully. The possibility exists that you could lose some or all of your investments, including your initial deposits. If in doubt, please seek independent expert advice. Visit www.forex.com/en-sg/terms-and-policies for the complete Risk Disclosure Statement.