



AUD/USD: Monthly indicators in China’s ‘data dump’ to dictate direction
The tentative rebound in the AUD/USD faces its next hurdle today with the release of China’s monthly ‘data dump’, including Q3 GDP.
Share this:

- China will release retail sales, industrial production, fixed asset investment and Q3 GDP today
- AUD/USD reaction may not be driven by the GDP print
- Australian jobs and inflation data over the next week has grown in importance following hawkish comments during the RBA’s October interest rate meeting.
The tentative rebound in the AUD/USD faces its next hurdle today with the release of China’s monthly ‘data dump’, including Q3 GDP. Given markets continue to equate weak economic data with a greater likelihood of additional stimulus measures, it will be interesting to see whether the Aussie can rally even if the data undershoots expectations.
China GDP unlikely to drive AUD/USD reaction
If there’s been a trend in recent Chinese economic data, it’s that activity seems to be stabilising at what are historically weak levels. Looking at what’s expected today, while the media will be all over the Q3 GDP figure with their coverage, what markets will be paying closer attention too is what the monthly data indicators are portraying.
According to economists polled by Bloomberg, industrial production is seen growing 4.4% from a year earlier, down a tenth on September, while retail sales are seen lifting three tenths to an annual pace of 4.9%. GDP is expected to decelerate to 4.4% from a year earlier, down from 6.3% ion Q2.
Bad is good, good is good?
For AUD/USD, there’s a valid argument it may be supported regardless of how the data prints. If it were to disappoint, it may stoke expectations of further stimulus measures from Chinese policymakers, a point underlined by reports in state media earlier this week discussing another potential reduction to the People’s Bank of China (PBOC) reserve requirement ratio for lenders. Alternatively, should the data beat, it will provide an encouraging picture on China’s growth trajectory, adding to the positive signal from China’s trade data last week which suggested demand for raw materials remained robust in September.
AUD/USD range continues to narrow
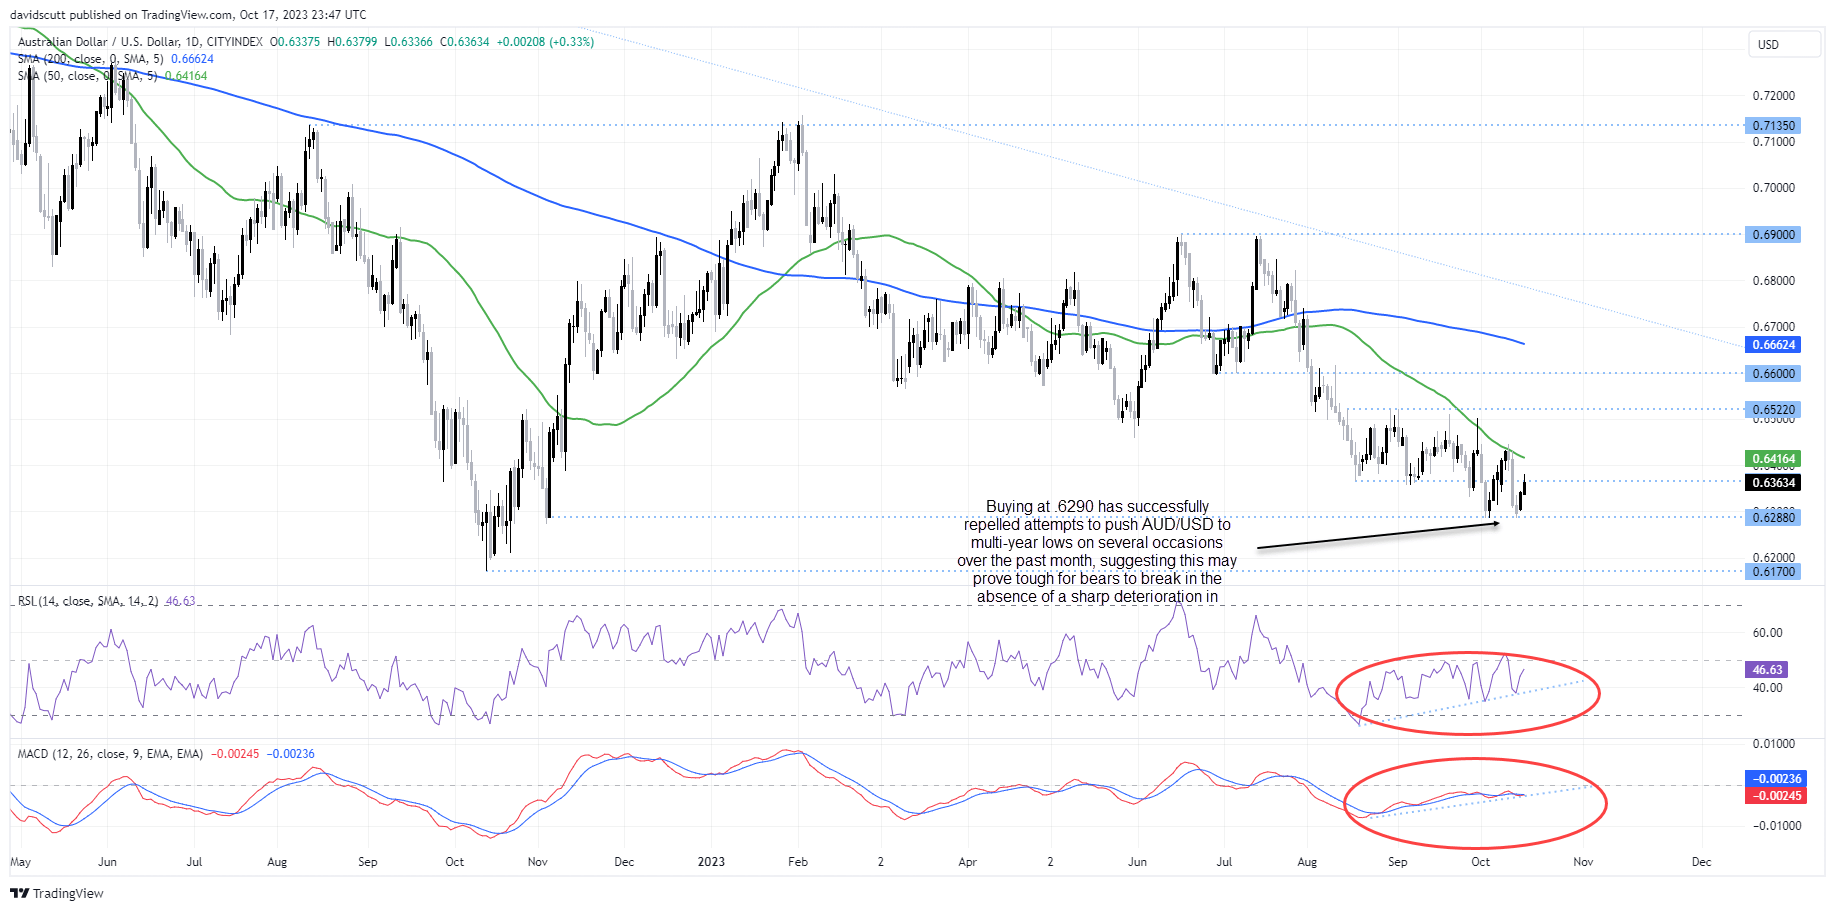
Looking at AUD/USD on the daily, one thing that stands out immediately is the range it’s trading in is becoming increasingly smaller, sandwiched between solid support below .6290 and the 50-day MA, currently located around .6416. Like a coiled spring, the tighter the range becomes, the more it feels like we may see an explosive move either to the downside or upside.
While today’s data is unlikely to deliver such a reaction, it may push the AUD/USD to the extremities of its current range, paving the way for news regarding the Israel-Hamas conflict or Australia’s jobs or CPI report over the next week to perhaps establish a new trajectory heading towards year-end.
On the downside, buyers have successfully repelled attempts to slam the AUD/USD below .6290 on multiple occasions over the past month, hinting this support zone may prove tough to crack in the absence of a significant deterioration in markets or the global growth outlook. In such a scenario, the next downside level to watch would be .6170, the low hit in October last year. On the topside, resistance has been previously seen at .6365, .6520 and again at .6600. Right now, RSI has diverged with recent price action, signaling a loss of downside momentum, while MACD is also trending higher.
-- Written by David Scutt
Follow David on Twitter @scutty
How to trade with City Index
You can trade with City Index by following these four easy steps:
- Open an account, or log in if you’re already a customer
• Open an account in the UK
• Open an account in Australia
• Open an account in Singapore
- Search for the market you want to trade in our award-winning platform
- Choose your position and size, and your stop and limit levels
- Place the trade
Latest market news




Open an account in minutes
Experience award-winning platforms with fast and secure execution, and enjoy tight spreads from 0.5 pts on FX and 0.3 pts on indices.
Economic calendar
Web Trader platform
Our sophisticated web-based platform is packed with features.
Related articles
USD into a Massive Week as Yields Fly and Gold Breaks
It’s a huge week with PCE and NFP, but it’s what’s happening off of the calendar that demands attention with US yields flying to fresh multi-decade highs.
AUD/USD forecast: Currency Pair of the Week | September 28, 2026
The week has started with stocks, gold, silver and bitcoin all falling, as crude oil rebounded and bond yields pushed further higher. Trump refusing to agree to Tehran’s proposal to re-open the Strait of Hormuz has left the markets disappointed. Still, reports that mediators are expected to hold talks with the two sides on an amended version of the 7-day proposal that Iran presented, keeps hopes alive that we may see some progress.


Australian Dollar Outlook: AUD/USD Holds 70c Ahead of RBA and CPI
AUD/USD faces an expected RBA hike and Australian CPI before attention turns to US PCE, ISM and nonfarm payrolls later in the week.

This report is intended for general circulation only. It should not be construed as a recommendation, or an offer (or solicitation of an offer) to buy or sell any financial products. The information provided does not take into account your specific investment objectives, financial situation or particular needs. Before you act on any recommendation that may be contained in this report, independent advice ought to be sought from a financial adviser regarding the suitability of the investment product, taking into account your specific investment objectives, financial situation or particular needs.
StoneX Financial Pte. Ltd., may distribute reports produced by its respective foreign entities or affiliates within the StoneX group of companies or third parties pursuant to an arrangement under Regulation 32C of the Financial Advisers Regulations. Where the report is distributed to a person in Singapore who is not an accredited investor, expert investor or an institutional investor (as defined in the Securities Futures Act), StoneX Financial Pte. Ltd. accepts legal responsibility to such persons for the contents of the report only to the extent required by law. Singapore recipients should contact StoneX Financial Pte. Ltd. at 6826 9988 for matters arising from, or in connection with the report.
In the case of all other recipients of this report, to the extent permitted by applicable laws and regulations neither StoneX Financial Pte. Ltd. nor its associated companies will be responsible or liable for any loss or damage incurred arising out of, or in connection with, any use of the information contained in this report and all such liability is hereby expressly disclaimed. No representation or warranty is made, express or implied, that the content of this report is complete or accurate.
StoneX Financial Pte. Ltd. is not under any obligation to update this report.
Trading CFDs carries a high level of risk that may not be suitable for some investors. Consider your investment objectives, level of experience, financial resources, risk appetite and other relevant circumstances carefully. The possibility exists that you could lose some or all of your investments, including your initial deposits. If in doubt, please seek independent expert advice. Visit www.forex.com/en-sg/terms-and-policies for the complete Risk Disclosure Statement.