



audusd risk of a short term mean reversion decline as rba looms 1855192017
<p>Next week, we will have RBA (Australian central bank) monetary policy meeting outcome on Tues, 04 July 2017 at 0430 GMT. In the last monetary […]</p>
Share this:

Next week, we will have RBA (Australian central bank) monetary policy meeting outcome on Tues, 04 July 2017 at 0430 GMT.
In the last monetary policy meeting, RBA had left its policy cash rate at a record low of 1.5% since August 2016 as expected. In its accompanying monetary policy statement, RBA has continued to strike an upbeat tone on Australian economic outlook, a continuation of its optimistic view from the previous May meeting. The labour market has remained resilient where the unemployment rate fell to a four-year low of 5.5% in May. This important an economic indicator to watch as RBA has hinted previously that a deterioration in the labour market could trigger another policy interest rate cut.
Despite a strong labour market in terms of headline jobs growth, wage growth has continued to be subdued where it recorded a record low growth rate of 1.9% annualised in Q1 2017, the same pace seen in the previous quarter, Q4 2016. We expect such slow wage growth rate to persist due to the following reasons:
- The recent increase in full-time jobs has not been accompanied by a drastic slowdown in the growth of underemployment as the share of the labour force which are underemployed only decrease to 8.8% in May from 8.9% seen in April.
- The underemployment rate has continued to be elevated which translates into only a slight improvement in the underutilisation rate (a broader measure of spare capacity) where it has declined only to 14.4% in May from 14.8% seen in February. This is still considered high in historical standards as before the Great Financial Crisis in 2008, it stood at around 10%.
- This excess spare capacity as reflected in the underutilisation rate should put a lid of wage growth.
Therefore, in a persistent low wage growth environment that is likely to prevent underlying inflation from soaring coupled with a record high level of household debt, we expect RBA to maintain status quo on its monetary policy stance and keep its key policy cash rate unchanged at 1.5%.
The AUD/USD has rallied by 6.2% since the start of 2017 that make it the third best performing major currencies against the USD (see chart below). However without any expected strong hawkish comments in the upcoming RBA’s monetary policy statement, the recent rally seen in the AUD/USD may find it hard to have a bullish breakout above the significant range resistance of 0.7710/7750.

Short-term technical outlook on AUD/USD

Key technical elements
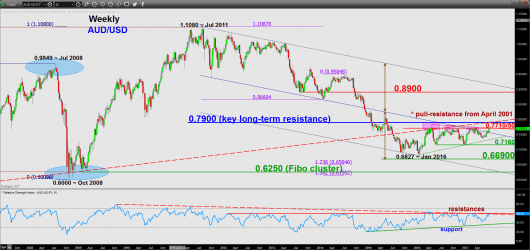
- The on-going rally from 22 June 2017 low of 0.7532 has reached the lower limit of the significant range top/resistance at 0.7710 that has capped previous up move since April 2016 (see weekly chart) Click here for a recap for our previous “Chart of the day” report.
- The aforementioned significant range resistance of 0.7710/7750 also confluences with the upper boundary of a short-term ascending channel in place since 02 June 2017 and a Fibonacci projection cluster.
- Short-term momentum indicator, the 4 Hour Stochastic oscillator has just exited from its overbought region which suggests that the on-going steep rally from 22 June 2017 low has been overextended where it faces the risk of a mean reversion decline at this juncture (see 4 hour chart).
- Based on the Elliot Wave Principal and fractal analysis, the price structure of the AUD/USD may have completed an intermediate degree five wave bullish impulsive structure from 09 May 2017 low of 0.7328 labelled as 1/, 2/, 3/, 4/ & 5/ with a potential 5th wave end target at 0.7727 (0.618 Fibonacci projection). Therefore, it implies that the AUD/USD faces the risk of at least a short-term down move to retrace the on-going rally from 22 June 2017 low.
- The next significant short-term support rests at the 0.7622/7610 zone which is defined by the former minor swing high areas of 15 June/19 June/27 June 2017, the lower boundary of the short-term ascending channel from 02 June 2017 low and the 23.6% Fibonacci retracement of the medium-term up move from 09 May 2017 low (see 4 hour chart).
Key levels (1 to 3 days)
Intermediate resistance: 0.7710
Pivot (key resistance): 0.7750
Supports: 0.7670 (downside trigger) & 0.7622/7610
Next resistance: 0.7900
Conclusion
After its recent steep rally seen from 22 June 2016 low of 0.7532, the AUD/USD now faces the risk of short-term mean reversion decline. As long as the 0.7750 pivotal resistance is not surpassed and a break below 0.7670, the AUD/USD is likely to see a decline towards the near-term support zone of 0.7622/10.
However, a clearance above 0.7750 is likely to invalidate the preferred short-term mean reversion decline scenario to open up scope for an extension of the on-going bullish impulsive upleg to target the 0.7900 key long-term resistance (the pull-back resistance of the former ascending trendline from April 2001 low).
Charts are from eSignal
Disclaimer
This report is intended for general circulation only. It should not be construed as a recommendation, or an offer (or solicitation of an offer) to buy or sell any financial products. The information provided does not take into account your specific investment objectives, financial situation or particular needs. Before you act on any recommendation that may be contained in this email, independent advice ought to be sought from a financial adviser regarding the suitability of the investment product, taking into account your specific investment objectives, financial situation or particular needs. All queries regarding the contents of this material are to be directed to City Index, a trading name of GAIN Capital Singapore Pte Ltd.
Trading CFDs and FX on margin carries a high level of risk that may not be suitable for some investors. Consider your investment objectives, level of experience, financial resources, risk appetite and other relevant circumstances carefully. The possibility exists that you could lose some or all of your investments, including your initial deposits. If in doubt, please seek independent expert advice. Visit cityindex.com.sg for the complete Risk Disclosure Statement.
Related tags:




Open an account in minutes
Experience award-winning platforms with fast and secure execution, and enjoy tight spreads from 0.5 pts on FX and 0.3 pts on indices.
Economic calendar
Web Trader platform
Our sophisticated web-based platform is packed with features.
Related articles
This report is intended for general circulation only. It should not be construed as a recommendation, or an offer (or solicitation of an offer) to buy or sell any financial products. The information provided does not take into account your specific investment objectives, financial situation or particular needs. Before you act on any recommendation that may be contained in this report, independent advice ought to be sought from a financial adviser regarding the suitability of the investment product, taking into account your specific investment objectives, financial situation or particular needs.
StoneX Financial Pte. Ltd., may distribute reports produced by its respective foreign entities or affiliates within the StoneX group of companies or third parties pursuant to an arrangement under Regulation 32C of the Financial Advisers Regulations. Where the report is distributed to a person in Singapore who is not an accredited investor, expert investor or an institutional investor (as defined in the Securities Futures Act), StoneX Financial Pte. Ltd. accepts legal responsibility to such persons for the contents of the report only to the extent required by law. Singapore recipients should contact StoneX Financial Pte. Ltd. at 6826 9988 for matters arising from, or in connection with the report.
In the case of all other recipients of this report, to the extent permitted by applicable laws and regulations neither StoneX Financial Pte. Ltd. nor its associated companies will be responsible or liable for any loss or damage incurred arising out of, or in connection with, any use of the information contained in this report and all such liability is hereby expressly disclaimed. No representation or warranty is made, express or implied, that the content of this report is complete or accurate.
StoneX Financial Pte. Ltd. is not under any obligation to update this report.
Trading CFDs carries a high level of risk that may not be suitable for some investors. Consider your investment objectives, level of experience, financial resources, risk appetite and other relevant circumstances carefully. The possibility exists that you could lose some or all of your investments, including your initial deposits. If in doubt, please seek independent expert advice. Visit www.forex.com/en-sg/terms-and-policies for the complete Risk Disclosure Statement.