



AUD/USD hammered by US yields and fading RBA hike bets
US yields, dollar strength and fading RBA hike bets have combined to drive AUD/USD to fresh multi-month lows. The macro and technical bias remains bearish, although history suggests parts of the move are now reaching unusually stretched levels.
Share this:

- US front-end yields posted historically large September increases
- DXY tracked two-year and five-year yields relatively closely
- RBA dovish repricing narrows Australia’s yield advantage
- AUD/USD momentum and US yield streaks look stretched
AUD/USD has been hammered lower this week, undermined by an unwind in hawkish RBA pricing following Tuesday’s interest rate decision and softer economic data either side of it, while the US dollar has continued to feed on higher Treasury yields, sending the pair to fresh multi-month lows.
While the fundamental factors behind the Aussie’s unwind are easy enough to identify, the question traders must ask themselves is how much further can they run? US yields across the front end and belly of the curve have risen for an unusually long period, coinciding with higher energy prices sparked by the Iran war, with history suggesting sustained moves of this length are rare.
When you throw in the fact the Aussie is becoming increasingly stretched across several technical measures, it provides a cautionary message. The bearish bias is obvious, but after the move already seen, this episode may be getting closer to its final innings than its opening ones.
Dollar rally finds support from US rates
Source: LSEG
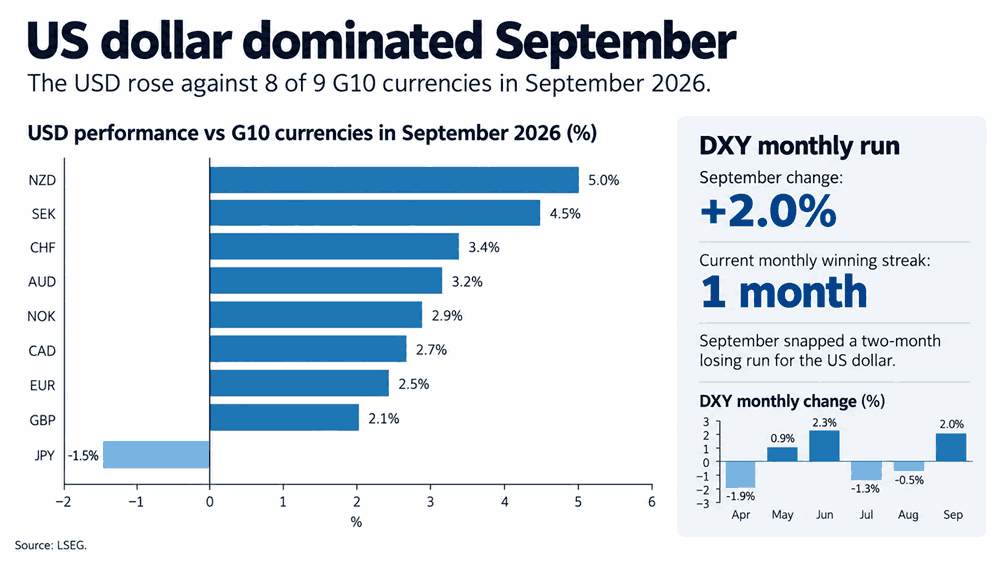
As seen in the graphic above, it’s not just the Aussie that struggled against the big dollar in September. The greenback rose against eight of nine G10 currencies over the month, with the only exception being the yen, which was arguably artificially boosted by the ongoing threat of intervention from US and Japanese authorities.
Source: LSEG
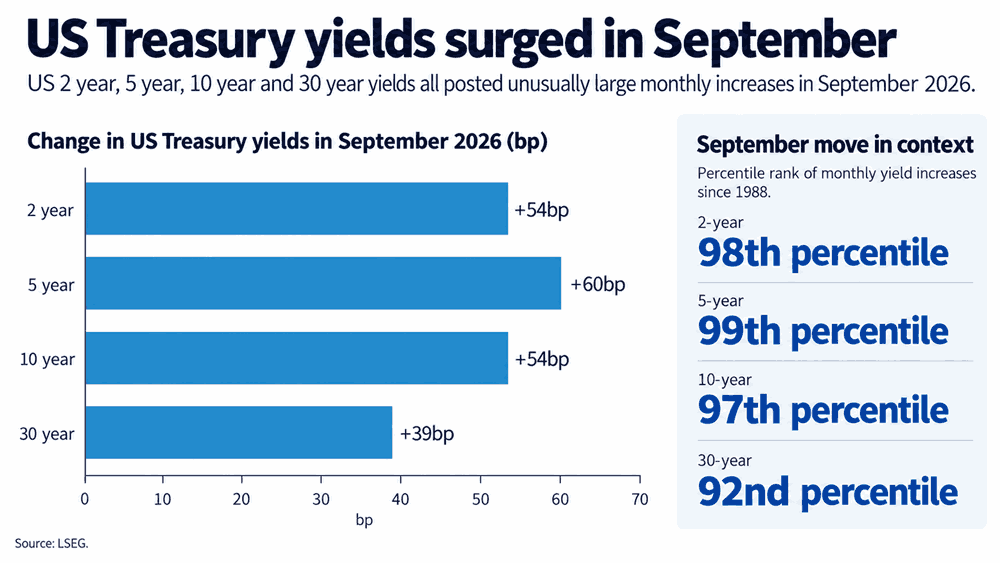
The broader dollar move coincided with an unusually aggressive sell-off in US Treasuries, particularly across the front end and belly of the curve. Two-year yields rose around 54 basis points over September, while five-year yields jumped roughly 60 basis points, placing both moves among the most extreme monthly increases seen across the historical dataset dating back to 1988.
Source: LSEG
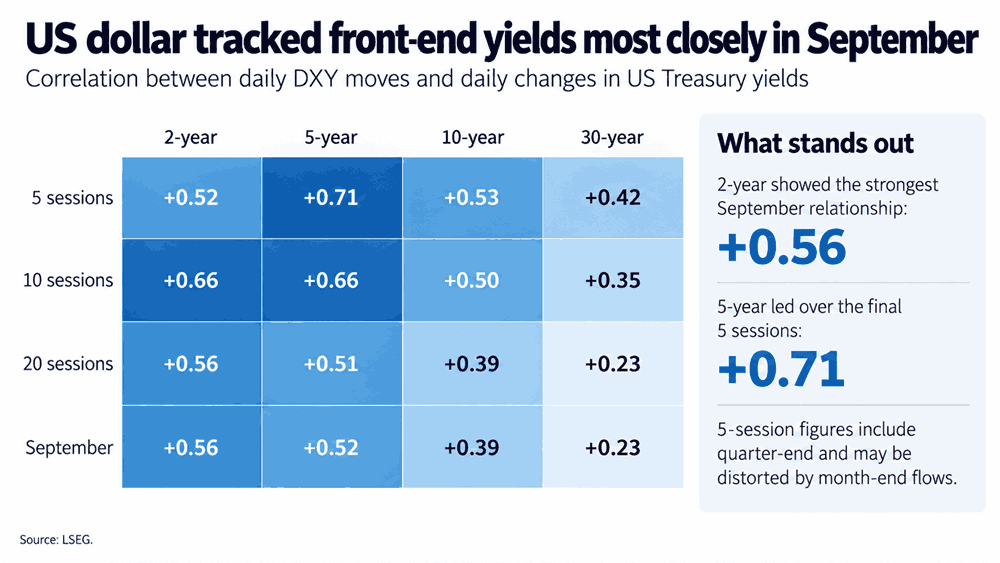
The large upward thrust in front-end yields has been an important factor behind the dollar’s rally over the month, with the correlation matrix above showing the relationship was strongest with the two-year and five-year tenors before weakening progressively further out the curve.
So while higher Treasury yields were not the only factor behind dollar strength, the evidence points to the front end and belly of the Treasury curve being an important factor underpinning the rally.
This content was created by an affiliate of FOREX.com and represents the views and opinions of the author/speakers, not the views and opinions of FOREX.com, StoneX Group Inc., or its subsidiaries. The content has not been independently reviewed by FOREX.com.
RBA hawkish pricing unwinds sharply
When it comes to the Aussie, domestic considerations have also been a factor behind its recent weakness. While the RBA hiked interest rates by 25 basis points earlier this week, as widely expected, and delivered a very hawkish statement, the tone of Governor Michele Bullock’s press conference was not as hawkish as markets had anticipated.
With household spending flat in August, and a marginal undershoot in both headline and trimmed mean inflation for the same month released yesterday, expectations for a back-to-back rate increase in November have been pared back sharply, falling from better than a coin flip to now around a one-in-four chance.
The repricing has helped pull Australian front-end yields lower at the same time US yields have continued to back up, narrowing the Aussie’s yield advantage over the US dollar.
AUD/USD bearish trend accelerates
Source: TradingView
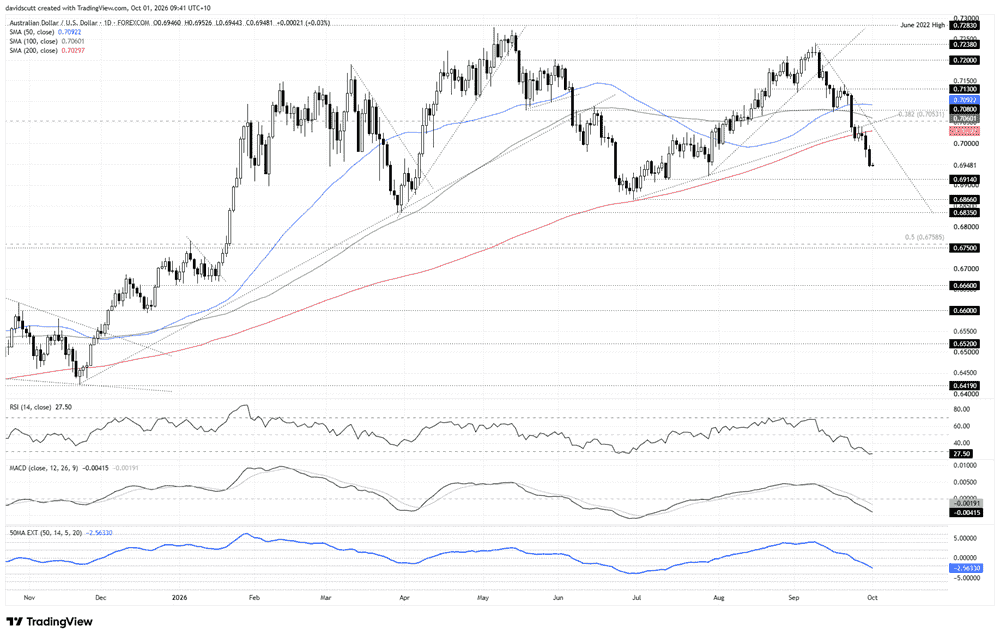
You can see the damage the yield compression has done to AUD/USD on the daily chart, with the pair establishing a clear bearish trend that has taken out not only the minor uptrend in place from the lows set in late June, but also the 200-day moving average before accelerating lower.
With RSI (14) and MACD delivering a complementary bearish message that downside pressure continues to build, it continues to favour selling into strength and downside breaks, putting levels such as 0.6920, the swing low set back in late July, 0.6914 and 0.6866 in play initially.
0.6835, which marked a double bottom in March this year, is another level of note, along with the far more influential support zone around the 50% retracement of the pandemic high-low, which capped the Aussie in late 2025 before the subsequent bullish break above it.
Overhead levels to watch include 0.7004, where the pair briefly found support earlier this week, although it’s only a minor level. Above that, the 200-day moving average and 38.2% Fibonacci retracement of the pandemic low-high are the more important levels to watch.
While the price action and momentum picture favours retention of a bearish bias, the speed of the current move is making the Aussie look a little stretched.
RSI (14) has fallen to around 27, a reading seen on less than 3% of sessions since 2007. More broadly, the combination of RSI below 30, price beneath the 200-day moving average and an ATR 50 stretch at least as negative as current levels has occurred on only around 4% of trading days over the same period.
Of course, that does not mean this bearish unwind is finished, but it provides a cautionary message that the risk-reward of chasing it lower from here may be becoming less attractive.
The Aussie stretch is not the only reason to be cautious about chasing downside in the pair, with history suggesting the sustained hawkish move at the front end of the US curve is also approaching historical extremes.
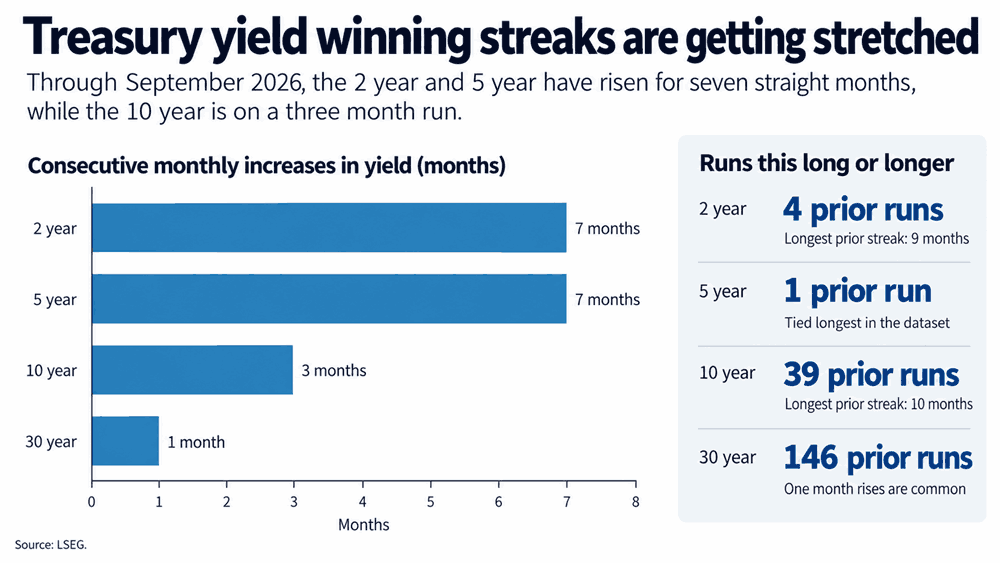
US two-year and five-year Treasury yields have risen for seven consecutive months, an unusually long run in modern times. There have only been four previous occasions where two-year yields have risen for at least seven straight months in the dataset, while the five-year has managed a run of this length only once before.
US yield streaks are entering rare territory
Source: LSEG
Again, that doesn’t mean the hawkish move at the front end of the US curve is over. But if that yield impulse begins to fade, one of the key forces that underpinned the dollar’s rally in September may lose some of its potency.
As such, while a bearish bias towards the Aussie remains undeniably preferred right now, appropriate risk-reward and position sizing should be considered when chasing lower levels.
Latest market news




Open an account in minutes
Experience award-winning platforms with fast and secure execution, and enjoy tight spreads from 0.5 pts on FX and 0.3 pts on indices.
Economic calendar
Web Trader platform
Our sophisticated web-based platform is packed with features.
Related articles
USD/CHF Feels the Weight of US Midterms, USD/CAD Clings to Support
US midterms threaten fresh dollar volatility as USD/CHF tests technical support and USD/CAD clings to 1.3940 ahead of election results.
US Dollar, GBP/USD, USD/CAD, USD/CHF, Gold Weekly Technical Outlook 11 2 2026
Sr. Technical Strategist Michael Boutros highlights the levels that matter on the USD Majors, commodities, and equity indices charts this week.

US Midterm Forecast: The Key Risks for Traders to Watch Through the US Elections
Prediction markets are pricing in nearly 75% odds of a Democratic sweep in this week’s US midterm elections, a development that would result in a split from the single party Republican rule of the past two years - what will it mean for markets?

This report is intended for general circulation only. It should not be construed as a recommendation, or an offer (or solicitation of an offer) to buy or sell any financial products. The information provided does not take into account your specific investment objectives, financial situation or particular needs. Before you act on any recommendation that may be contained in this report, independent advice ought to be sought from a financial adviser regarding the suitability of the investment product, taking into account your specific investment objectives, financial situation or particular needs.
StoneX Financial Pte. Ltd., may distribute reports produced by its respective foreign entities or affiliates within the StoneX group of companies or third parties pursuant to an arrangement under Regulation 32C of the Financial Advisers Regulations. Where the report is distributed to a person in Singapore who is not an accredited investor, expert investor or an institutional investor (as defined in the Securities Futures Act), StoneX Financial Pte. Ltd. accepts legal responsibility to such persons for the contents of the report only to the extent required by law. Singapore recipients should contact StoneX Financial Pte. Ltd. at 6826 9988 for matters arising from, or in connection with the report.
In the case of all other recipients of this report, to the extent permitted by applicable laws and regulations neither StoneX Financial Pte. Ltd. nor its associated companies will be responsible or liable for any loss or damage incurred arising out of, or in connection with, any use of the information contained in this report and all such liability is hereby expressly disclaimed. No representation or warranty is made, express or implied, that the content of this report is complete or accurate.
StoneX Financial Pte. Ltd. is not under any obligation to update this report.
Trading CFDs carries a high level of risk that may not be suitable for some investors. Consider your investment objectives, level of experience, financial resources, risk appetite and other relevant circumstances carefully. The possibility exists that you could lose some or all of your investments, including your initial deposits. If in doubt, please seek independent expert advice. Visit www.forex.com/en-sg/terms-and-policies for the complete Risk Disclosure Statement.