



Bitcoin & Nasdaq Forecast: Is Another Drawdown Ahead for Risk Assets?
Bitcoin and Nasdaq Forecast: Rising rate hike expectations, stronger DXY, and renewed US-Iran tensions increase pressure on risk assets.
Share this:

Risk assets face mounting pressure as rising rate hike expectations and renewed US-Iran tensions weigh on investor sentiment.
Two Key Market Drivers in Focus
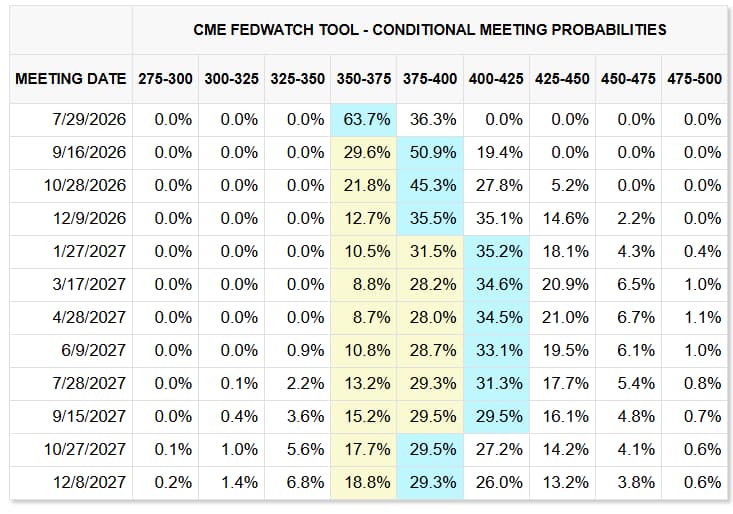
- Rate hike expectations rise over 50% towards year end.
- Progress on the US-Iran peace deal has stalled amid disagreements over Iran's nuclear program and developments on the Lebanon front.
CME FedWatch Tool
Source: CME
Following Kevin Warsh's hawkish tone, expectations for tighter monetary policy have strengthened, while renewed geopolitical uncertainty has added another layer of pressure across financial markets.
As a result:
- DXY is testing one-year highs near 101.
- USDJPY is trading near two-year and multi decade highs around 161.
- Gold and silver have retreated toward yearly lows near 4120 and 65 respectively.
- Nasdaq remains under pressure below 30,400, coinciding with a decline of more than 20% in SpaceX shares from their 225 peak.
- US 2-year Treasury yields have returned toward yearly highs above 4%.
- Crude oil has rebounded from the 73.50 low toward 76.
I discuss these charts and scenarios daily during the MENA Market Call.
Bitcoin Price Forecast: Daily Time Frame – Log Scale
Source: TradingView
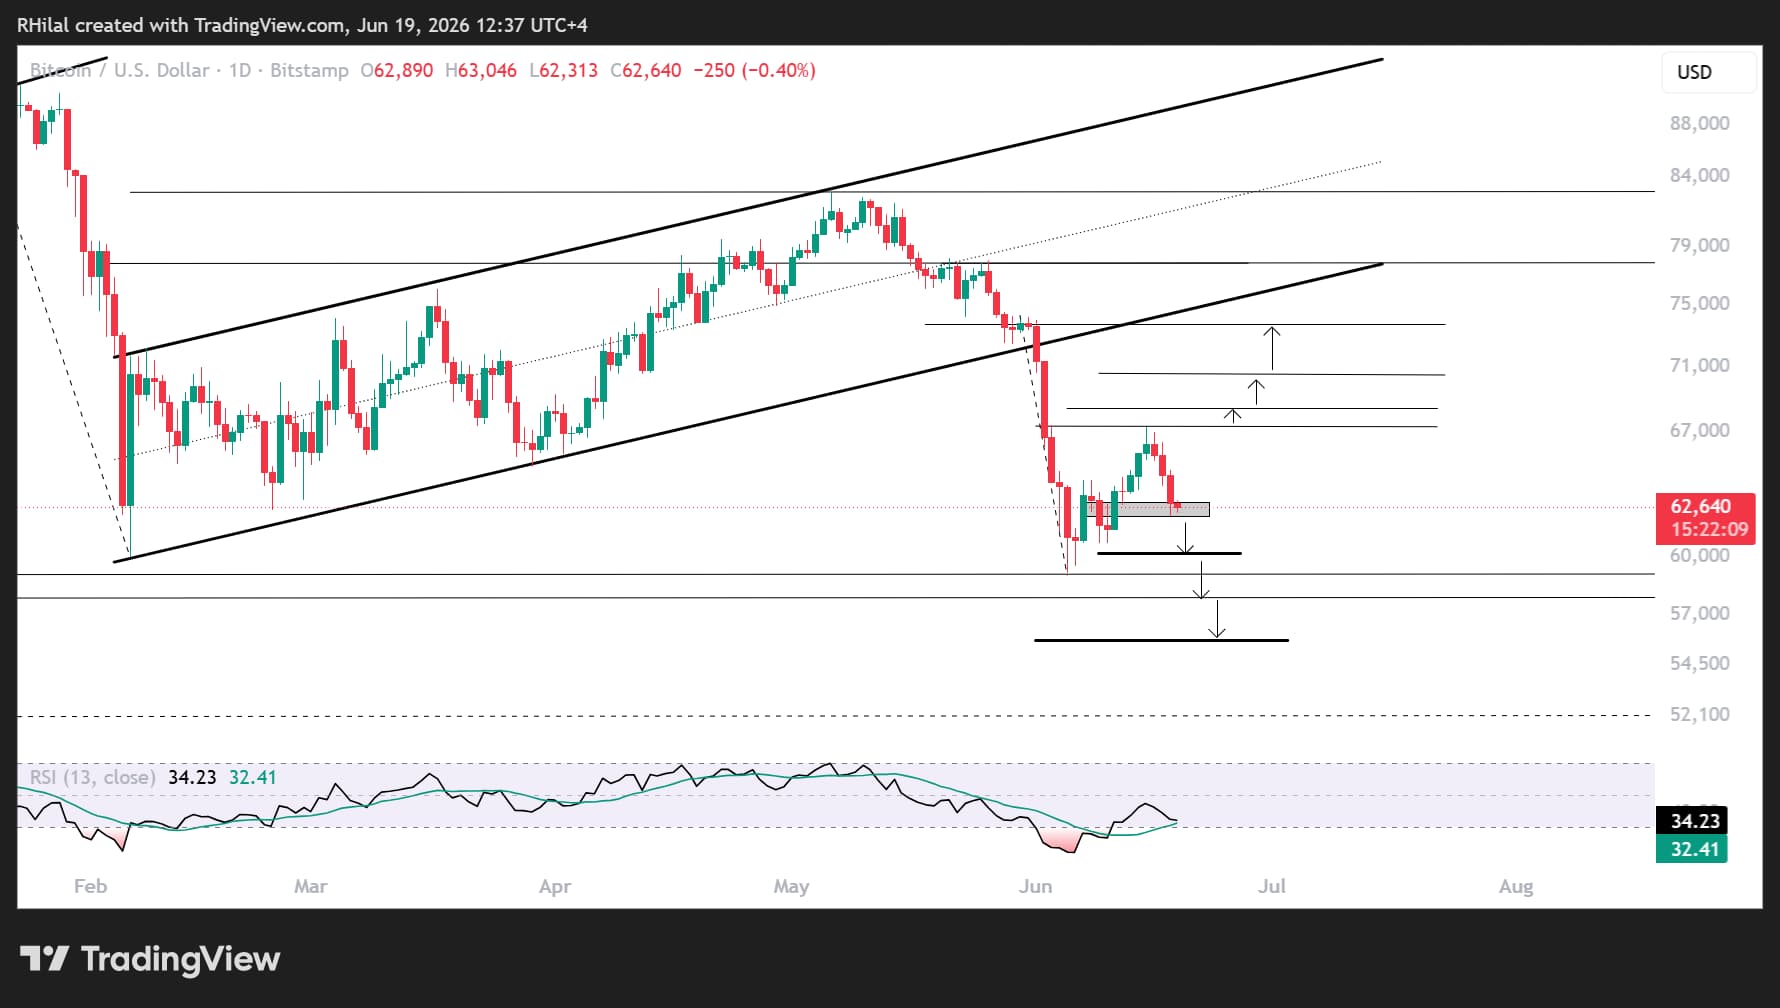
Dominant Framework: Bitcoin Remains Under Pressure Below 67,000
Bitcoin remains under pressure below the 67,000 resistance zone, which coincides with the 44% Fibonacci retracement of the May 26–June low decline.
This comes despite a rebound from the yearly low near 59,000 and a recovery from oversold momentum conditions not seen since 2022.
The recovery remains fragile and closely tied to broader market sentiment, particularly the interaction between elevated AI-related valuations, rising interest rate expectations, and geopolitical developments in the Middle East, all of which continue to influence liquidity conditions across risk assets.
Bearish Scenario – Breakdown Below 62,000
A breakdown below the 62,000 support level would expose the following downside targets:
- 59,000
- 55,000
- 48,000
This represents approximately another 10,000-point downside move from current levels.
The region aligns with the August 2024 lows and may provide another attractive long-term dip-buying opportunity for investors.
Bullish Scenario – Reclaiming 65,000 and 67,000
If bullish momentum strengthens and Bitcoin reclaims both the 65,000 and 67,000 resistance levels on a closing basis, attention would shift toward:
- 68,000 (50% Fibonacci retracement) of the May 26–June low decline
- 70,000 (61.8% Fibonacci retracement)
- 74,000 (78.6% Fibonacci retracement and the lower boundary of the previously respected channel)
This setup mirrors the technical framework currently developing in silver.
A sustained breakout above these levels would significantly strengthen the bullish case, opening the path toward the 90,000 region and potentially new record highs over the longer term.
For now, bearish dominance persists.
Nasdaq Price Forecast: 4H – Daily Time Frame – Log Scale

Source: TradingView
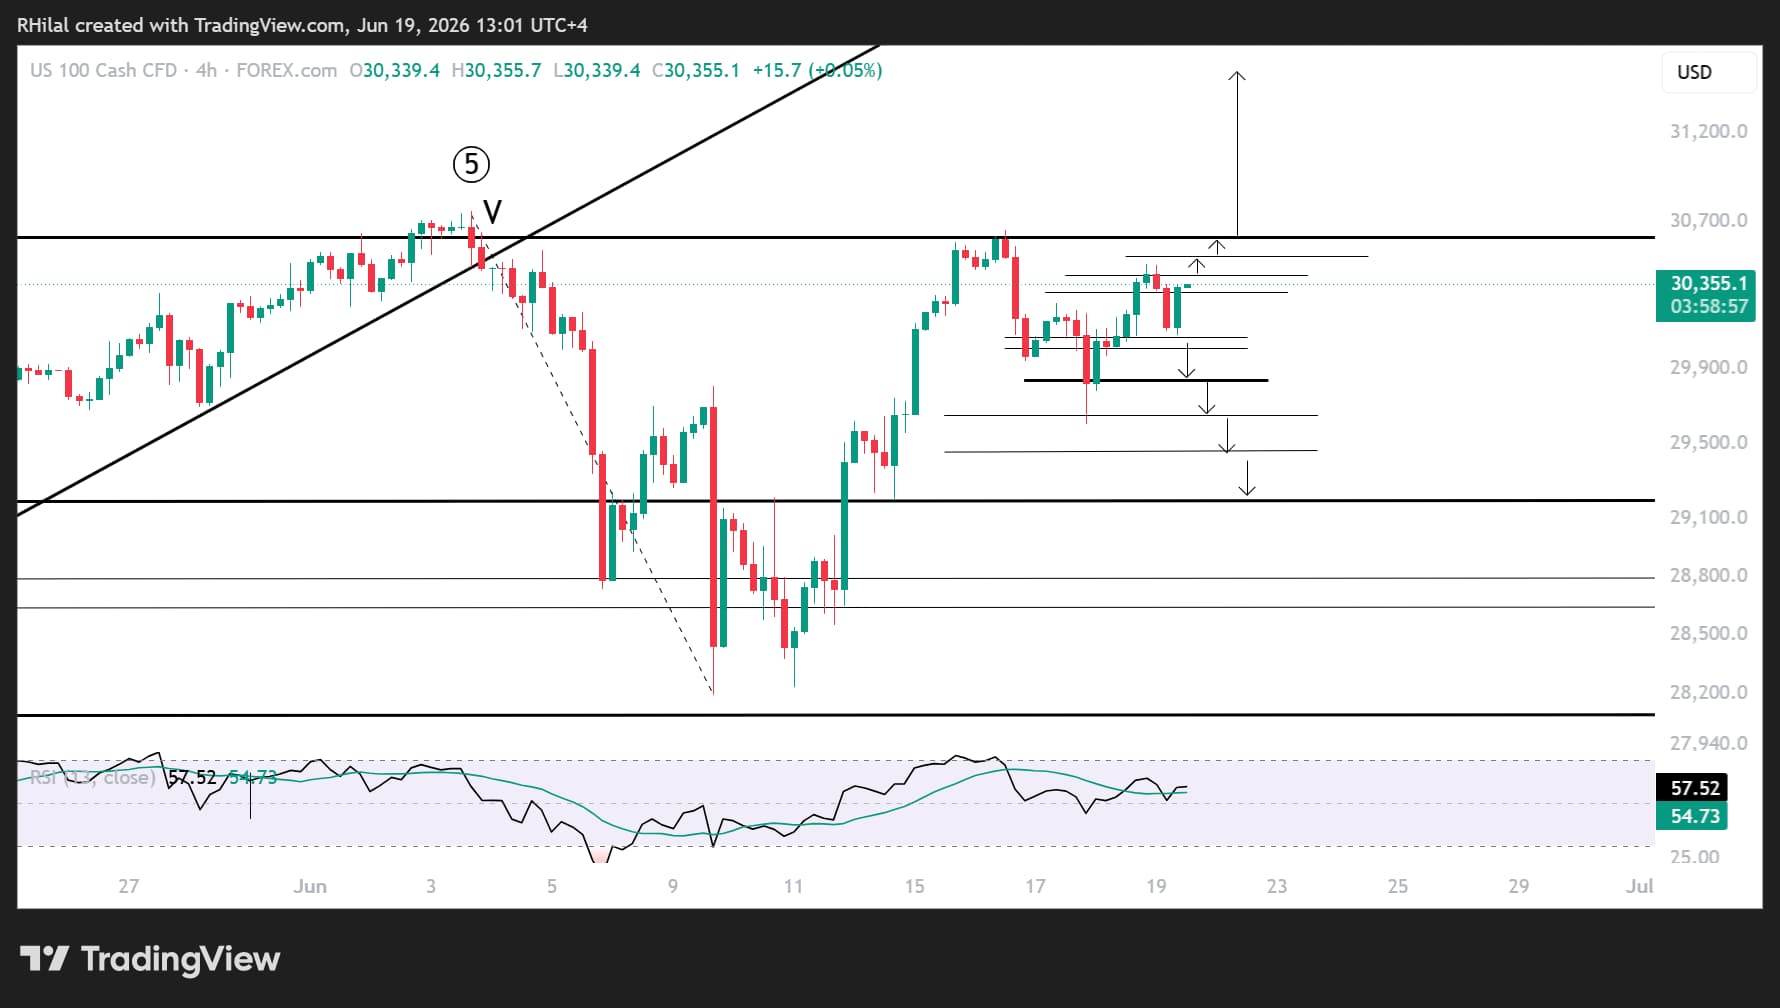
Dominant Framework: Nasdaq Remains in a Cautious Hold Above 30,000
The index continues to hold above the 29,600–30,000 support zone, emphasizing that buyers continue to defend this key area despite rising macroeconomic headwinds.
However, expectations for further gains remain uncertain given the evolving monetary policy and geopolitical landscape.
Bearish Scenario – Breakdown Below 29,600
A renewed breakdown below the 29,600–30,000 support zone, followed by a sustained move below 29,400, would reinforce bearish momentum.
Downside targets include:
- 29,140 - This level may serve as either a dip-buying zone or area where renewed selling pressure emerges towards 28600 - 28200
Momentum Still Supports the Bullish Case
The RSI continues to show signs of stabilization, attempting a bullish rebound above both its moving average and key resistance levels.
Momentum remains above the neutral 50 mark on both the daily and 4-hour timeframes, keeping the bullish scenario valid for now.
Bullish Scenario – Reclaiming 30,500
If bullish momentum returns and the Nasdaq successfully reclaims the 30,500 resistance zone, attention would shift toward the next record highs.
Such a move could trigger another 1,000-point advance toward the 31,500–31,700 region.
This target aligns with the 100% Fibonacci extension of the cycle spanning April 2025, January 2026, and March 2026.
A successful move into this region would reinforce the longer-term bullish trend and signal that investors remain willing to buy dips despite elevated valuations and tighter financial conditions.
DXY and Geopolitics Remain the Key Drivers
For now, both Bitcoin and the Nasdaq remain highly sensitive to shifts in monetary policy expectations and geopolitical developments.
With DXY testing fresh highs and rate hike expectations continuing to build, risk assets may remain vulnerable to another corrective phase unless key resistance levels are reclaimed in the sessions ahead.
The interaction between a stronger US dollar, rising bond yields, and renewed Middle East tensions will likely determine whether current pullbacks evolve into broader drawdowns or remain temporary corrections within longer-term bullish trends.
Written by Razan Hilal, CMT
Follow on X: @Rh_waves
Latest market news




Open an account in minutes
Experience award-winning platforms with fast and secure execution, and enjoy tight spreads from 0.5 pts on FX and 0.3 pts on indices.
Economic calendar
Web Trader platform
Our sophisticated web-based platform is packed with features.
Related articles
Q4 2026 Bitcoin Outlook: Did the August Rally Mark the Cycle Low?
The outlook for Bitcoin in Q4 is turning cautiously optimistic on the back of renewed ETF purchases, compelling valuations, and an improvement in buy-and-hold behavior among investors - see the full analysis!
Japanese Yen Forecast: USD/JPY 4% Rally Challenges Post-Intervention Downtrend 9 24 2026
USD/JPY momentum has shifted sharply higher, putting a major resistance confluence in focus as U.S. and Japanese event risk builds.

GBP/USD, DJIA Outlook: Support Levels Meet Oversold Risks
GBP/USD and the Dow test key support levels as rising Treasury yields, Fed rate-hike expectations and oversold momentum increase reversal risks.
This report is intended for general circulation only. It should not be construed as a recommendation, or an offer (or solicitation of an offer) to buy or sell any financial products. The information provided does not take into account your specific investment objectives, financial situation or particular needs. Before you act on any recommendation that may be contained in this report, independent advice ought to be sought from a financial adviser regarding the suitability of the investment product, taking into account your specific investment objectives, financial situation or particular needs.
StoneX Financial Pte. Ltd., may distribute reports produced by its respective foreign entities or affiliates within the StoneX group of companies or third parties pursuant to an arrangement under Regulation 32C of the Financial Advisers Regulations. Where the report is distributed to a person in Singapore who is not an accredited investor, expert investor or an institutional investor (as defined in the Securities Futures Act), StoneX Financial Pte. Ltd. accepts legal responsibility to such persons for the contents of the report only to the extent required by law. Singapore recipients should contact StoneX Financial Pte. Ltd. at 6826 9988 for matters arising from, or in connection with the report.
In the case of all other recipients of this report, to the extent permitted by applicable laws and regulations neither StoneX Financial Pte. Ltd. nor its associated companies will be responsible or liable for any loss or damage incurred arising out of, or in connection with, any use of the information contained in this report and all such liability is hereby expressly disclaimed. No representation or warranty is made, express or implied, that the content of this report is complete or accurate.
StoneX Financial Pte. Ltd. is not under any obligation to update this report.
Trading CFDs carries a high level of risk that may not be suitable for some investors. Consider your investment objectives, level of experience, financial resources, risk appetite and other relevant circumstances carefully. The possibility exists that you could lose some or all of your investments, including your initial deposits. If in doubt, please seek independent expert advice. Visit www.forex.com/en-sg/terms-and-policies for the complete Risk Disclosure Statement.