






Bitcoin on the Move
There has been lots of chatter lately surrounding Bitcoin
Share this:

There has been lots of chatter lately surrounding Bitcoin (BTC), with price today rising almost 12.5% to an intraday high of $8,970. One reason is that in the coming weeks, Bitcoin will be “halving”. For simplicity sake, this means that every time 210,000 “blocks” are created by miners, the total number of Bitcoin are cut in half. This process is currently on pace to end in the year 2140, with a total of 21 million coins. When the halving happens in mid-May, supply will decrease while the expected demand is to remain the same. Theoretically, this should drive up the price. Bitcoin has halved twice before, once in 2012 and the second time in 2016. After the 2016 halving, price eventually rose to its all-time highs near $19,666 (however not immediately) before pulling back to $5,920 less than 2 months later. The halving is based on a mathematical equation. Given the current rate at which Bitcoin are mined, the date of the halving is roughly known, so are people buying ahead of it?
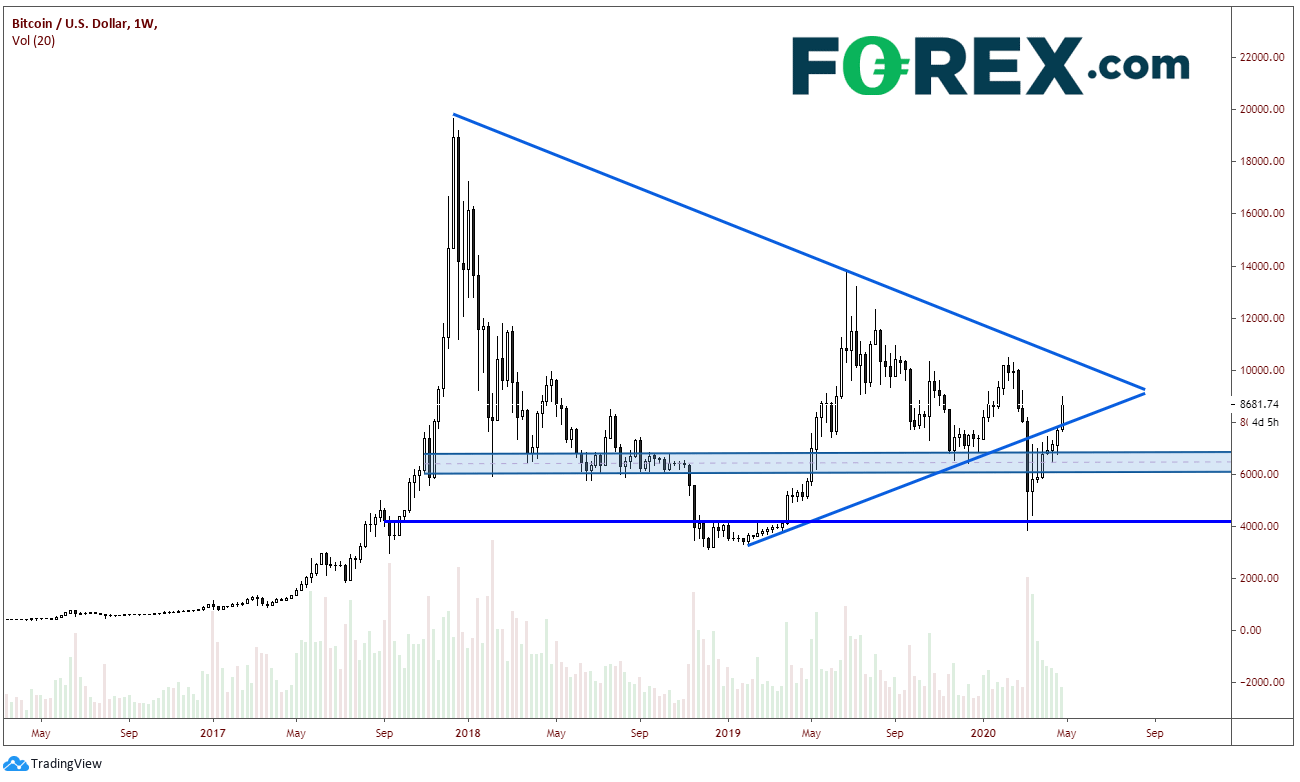
On a weekly timeframe, price had broken lower out of a symmetrical triangle during the week of March 9th, which proved to be a false break lower. Today, price moved back into the triangle. Often times, when we see a false break in one direction out of a triangle, price will move to test the other side of the triangle, which in this case is near $10,500.
Source: Tradingview, City Index
The other reason people have been talking about Bitcoin lately is because of its recent move higher with stocks. Wasn’t Bitcoin supposed to be a hedge to risky assets? Often during 2019, when stocks moved higher, Bitcoin moved lower. It was considered a “storage of wealth”, just like gold. However, as we can see from the correlation coefficient on a daily timeframe, during times of extreme volatility (such as the last 2 months) BTC has been a coincidental indicator. The crypto currency has been moving in tandem with stocks rather than opposite stocks.
Source: Tradingview, City Index
As BTC moved higher back into the triangle today, BTC halted right at the 50% retracement level from the highs of June 29, 2019 to the lows of March 20th near $8,810. There is also horizontal resistance at this level. Next horizontal resistance is at $9,400 and then the 61.8% Fibonacci retracement level from the previously mentioned timeframe near $9,994. Trendline support below at the $7,922 and then today’s lows of $7,717. Below that is horizontal support at $7,469.
Will BTC move higher? Well, if it is a buy the rumor, sell the fact move we are seeing into the halving, and the halving won’t take place for a few more weeks, then it could. Stocks also pushed through the 61.8% Fibonacci retracement today from the February 20th highs to the March 23rd lows. So, if BTC is following stocks, then it could. However, stocks are running into resistance between 2962 and 2973. If stocks turn lower from here, BTC could also move lower with them.
There has been lots of chatter lately surrounding Bitcoin (BTC), with price today rising almost 12.5% to an intraday high of $8,970. One reason is that in the coming weeks, Bitcoin will be “halving”. For simplicity sake, this means that every time 210,000 “blocks” are created by miners, the total number of Bitcoin are cut in half. This process is currently on pace to end in the year 2140, with a total of 21 million coins. When the halving happens in mid-May, supply will decrease while the expected demand is to remain the same. Theoretically, this should drive up the price. Bitcoin has halved twice before, once in 2012 and the second time in 2016. After the 2016 halving, price eventually rose to its all-time highs near $19,666 (however not immediately) before pulling back to $5,920 less than 2 months later. The halving is based on a mathematical equation. Given the current rate at which Bitcoin are mined, the date of the halving is roughly known, so are people buying ahead of it?
On a weekly timeframe, price had broken lower out of a symmetrical triangle during the week of March 9th, which proved to be a false break lower. Today, price moved back into the triangle. Often times, when we see a false break in one direction out of a triangle, price will move to test the other side of the triangle, which in this case is near $10,500.
Source: Tradingview, FOREX.com
The other reason people have been talking about Bitcoin lately is because of its recent move higher with stocks. Wasn’t Bitcoin supposed to be a hedge to risky assets? Often during 2019, when stocks moved higher, Bitcoin moved lower. It was considered a “storage of wealth”, just like gold. However, as we can see from the correlation coefficient on a daily timeframe, during times of extreme volatility (such as the last 2 months) BTC has been a coincidental indicator. The crypto currency has been moving in tandem with stocks rather than opposite stocks.
Source: Tradingview, FOREX.com
As BTC moved higher back into the triangle today, BTC halted right at the 50% retracement level from the highs of June 29, 2019 to the lows of March 20th near $8,810. There is also horizontal resistance at this level. Next horizontal resistance is at $9,400 and then the 61.8% Fibonacci retracement level from the previously mentioned timeframe near $9,994. Trendline support below at the $7,922 and then today’s lows of $7,717. Below that is horizontal support at $7,469.
Will BTC move higher? Well, if it is a buy the rumor, sell the fact move we are seeing into the halving, and the halving won’t take place for a few more weeks, then it could. Stocks also pushed through the 61.8% Fibonacci retracement today from the February 20th highs to the March 23rd lows. So, if BTC is following stocks, then it could. However, stocks are running into resistance between 2962 and 2973. If stocks turn lower from here, BTC could also move lower with them.
Related tags:
Latest market news




Open an account in minutes
Experience award-winning platforms with fast and secure execution, and enjoy tight spreads from 0.5 pts on FX and 0.3 pts on indices.
Economic calendar
Web Trader platform
Our sophisticated web-based platform is packed with features.
Related articles

Gold Dips Below Three-Month Uptrend, Bitcoin Pulls Back from Nine-Month High
Gold has dipped below its three-month uptrend, while Bitcoin has pulled back from a nine-month high as U.S. bond yields test levels last seen in 2004 and 2007. Risks build as Fed rate-hike expectations remain above 70%, while the Dollar Index holds near yearly highs.


Q4 2026 Bitcoin Outlook: Did the August Rally Mark the Cycle Low?
The outlook for Bitcoin in Q4 is turning cautiously optimistic on the back of renewed ETF purchases, compelling valuations, and an improvement in buy-and-hold behavior among investors - see the full analysis!


Bitcoin Technical Outlook: BTC/USD Major Breakout Signals Crypto Winter May Be Over 9 22 2026
A 50% surge from the yearly low has transformed Bitcoin’s technical backdrop, with bulls now targeting the next major hurdle at the yearly open.

This report is intended for general circulation only. It should not be construed as a recommendation, or an offer (or solicitation of an offer) to buy or sell any financial products. The information provided does not take into account your specific investment objectives, financial situation or particular needs. Before you act on any recommendation that may be contained in this report, independent advice ought to be sought from a financial adviser regarding the suitability of the investment product, taking into account your specific investment objectives, financial situation or particular needs.
StoneX Financial Pte. Ltd., may distribute reports produced by its respective foreign entities or affiliates within the StoneX group of companies or third parties pursuant to an arrangement under Regulation 32C of the Financial Advisers Regulations. Where the report is distributed to a person in Singapore who is not an accredited investor, expert investor or an institutional investor (as defined in the Securities Futures Act), StoneX Financial Pte. Ltd. accepts legal responsibility to such persons for the contents of the report only to the extent required by law. Singapore recipients should contact StoneX Financial Pte. Ltd. at 6826 9988 for matters arising from, or in connection with the report.
In the case of all other recipients of this report, to the extent permitted by applicable laws and regulations neither StoneX Financial Pte. Ltd. nor its associated companies will be responsible or liable for any loss or damage incurred arising out of, or in connection with, any use of the information contained in this report and all such liability is hereby expressly disclaimed. No representation or warranty is made, express or implied, that the content of this report is complete or accurate.
StoneX Financial Pte. Ltd. is not under any obligation to update this report.
Trading CFDs carries a high level of risk that may not be suitable for some investors. Consider your investment objectives, level of experience, financial resources, risk appetite and other relevant circumstances carefully. The possibility exists that you could lose some or all of your investments, including your initial deposits. If in doubt, please seek independent expert advice. Visit www.forex.com/en-sg/terms-and-policies for the complete Risk Disclosure Statement.