



Bitcoin technical analysis: Markets await FOMC decision
Still disappointed from yesterday’s news that the CLARTY Act, a digital-asset market-structure bill, failed to clear the threshold required to advance to full Senate consideration, crypto traders were not in the mood to buy the dip. But what are the charts telling us?
Share this:

Ahead of the FOMC rate decision, markets were all over the place, as traders largely sat on their hands and awaited the release the Fed’s policy statement and hear from Chairman Kevin Warsh. Still disappointed from yesterday’s news that the CLARTY Act, a digital-asset market-structure bill, failed to clear the threshold required to advance to full Senate consideration, crypto traders were not in the mood to buy the dip. But what are the charts telling us?
Bitcoin technical analysis
Well, the chart of Bitcoin is not looking particularly promising after it ended weeks of consolidation with a breakdown yesterday. The clue for the breakdown came when bitcoin made a failed attempt to break higher in early September when that key $80K-$82K resistance held and that triggered some unwinding of longs, leading to an eventual drop below support near $76.2K. This level was being tested now from underneath at the time of writing.
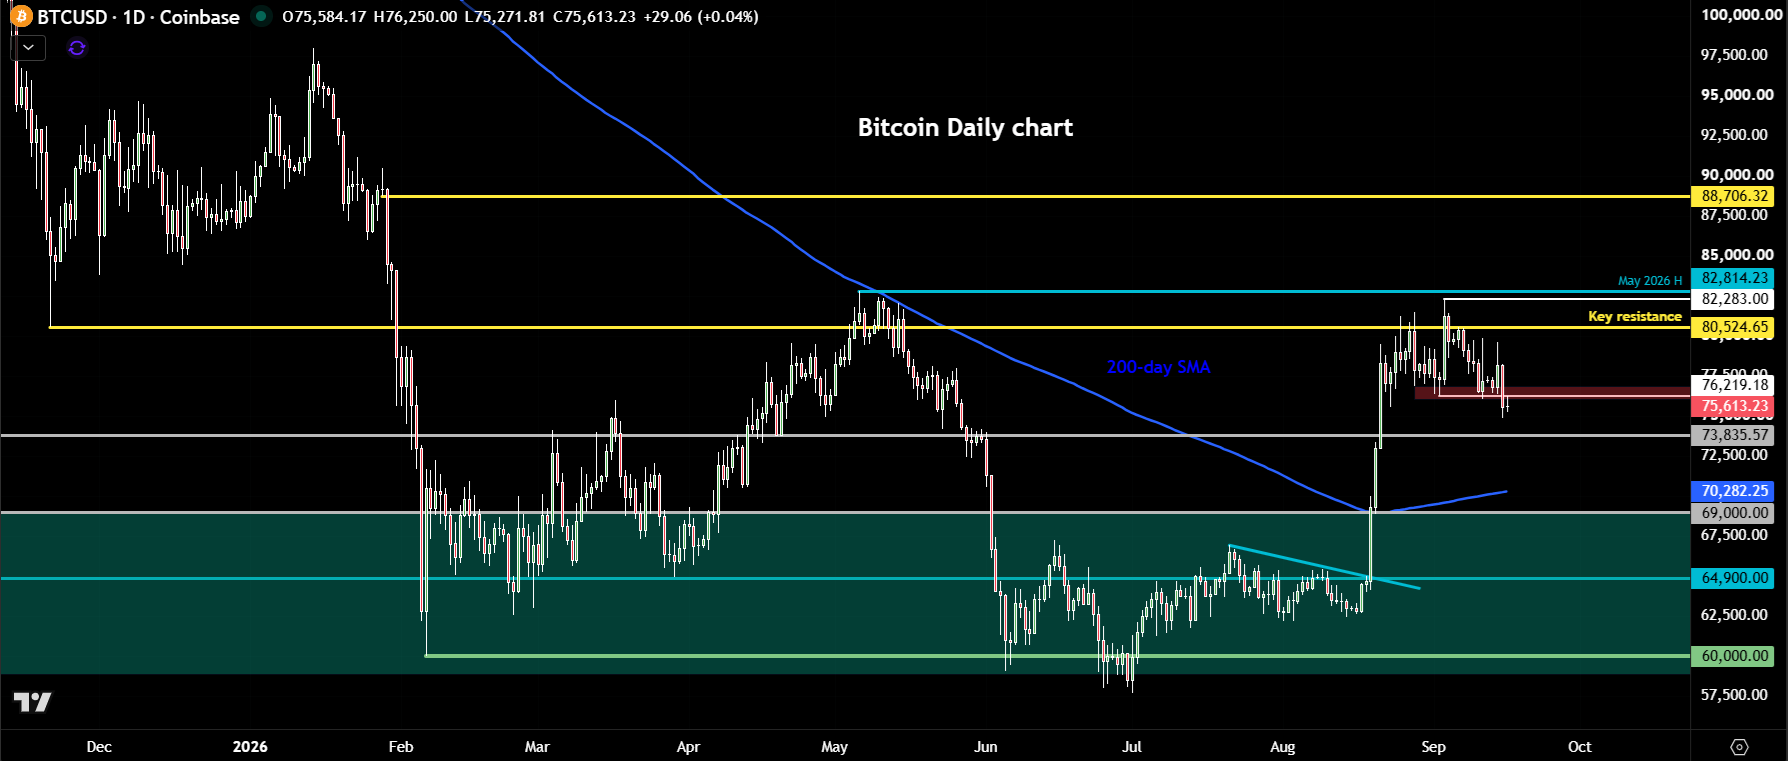
Yesterday saw Bitcoin completely give up Monday’s entire gains and some. At one point on Monday, it looked like the cryptocurrency was about to stage a breakout when it rallied above $79K, but here it ran into some resistance later on in that session, leading to a pullback from the highs.
For now, it has found some support around $75K to 75.5K area. Still, with recent price action being a little bearish, I wouldn't be surprised to see the selling pressure resume later on in the day.
Key levels to watch on BTC/USD
Should BTC/USD go below the $75,000 psychologically important level, there's not much in the way of obvious support until all the way around the 200-day moving average of $70,200/300 area. So, there is a possibility for a sharp correction to around the 200-day, if not more, FOMC permitting.
Alternatively, if Bitcoin now forms a bullish reversal candle on a closing basis, then that could be an early indication that finally it is ready to break higher because it has been stuck inside this chop zone and major resistance below $80,000 - $82,800 for a number of weeks. For confirmation, a clear break above this important technical zone is needed to form a higher high. If that happens, it would be a major bullish development. For the time being though the path of each resistance remains to the downside.
Related tags:
Latest market news




Open an account in minutes
Experience award-winning platforms with fast and secure execution, and enjoy tight spreads from 0.5 pts on FX and 0.3 pts on indices.
Economic calendar
Web Trader platform
Our sophisticated web-based platform is packed with features.
Related articles
Silver forecast: metals liquidation drags XAG/USD into $50-55 support
Silver has broken its July low and slipped into a long-term support zone as the selling in precious metals deepens. The chart shows where the metal could bottom, and next week's Fed decision may decide whether it does.

S&P 500 forecast: AI linked stocks remain under pressure
And just like that, it is Friday again and the end of a volatile week. Today offers little on the macro calendar to change the prevailing narrative, leaving markets largely at the mercy of risk appetite, oil prices and the growing unease around the AI trade.

Nasdaq 100 Slides as Meta Posts Strong Results and Drops 6%
The Nasdaq 100 sell-off is being driven by doubts over AI spending, as investors punish strong earnings that fail to justify stretched valuations.
This report is intended for general circulation only. It should not be construed as a recommendation, or an offer (or solicitation of an offer) to buy or sell any financial products. The information provided does not take into account your specific investment objectives, financial situation or particular needs. Before you act on any recommendation that may be contained in this report, independent advice ought to be sought from a financial adviser regarding the suitability of the investment product, taking into account your specific investment objectives, financial situation or particular needs.
StoneX Financial Pte. Ltd., may distribute reports produced by its respective foreign entities or affiliates within the StoneX group of companies or third parties pursuant to an arrangement under Regulation 32C of the Financial Advisers Regulations. Where the report is distributed to a person in Singapore who is not an accredited investor, expert investor or an institutional investor (as defined in the Securities Futures Act), StoneX Financial Pte. Ltd. accepts legal responsibility to such persons for the contents of the report only to the extent required by law. Singapore recipients should contact StoneX Financial Pte. Ltd. at 6826 9988 for matters arising from, or in connection with the report.
In the case of all other recipients of this report, to the extent permitted by applicable laws and regulations neither StoneX Financial Pte. Ltd. nor its associated companies will be responsible or liable for any loss or damage incurred arising out of, or in connection with, any use of the information contained in this report and all such liability is hereby expressly disclaimed. No representation or warranty is made, express or implied, that the content of this report is complete or accurate.
StoneX Financial Pte. Ltd. is not under any obligation to update this report.
Trading CFDs carries a high level of risk that may not be suitable for some investors. Consider your investment objectives, level of experience, financial resources, risk appetite and other relevant circumstances carefully. The possibility exists that you could lose some or all of your investments, including your initial deposits. If in doubt, please seek independent expert advice. Visit www.forex.com/en-sg/terms-and-policies for the complete Risk Disclosure Statement.