



Bonds Arent Believing the Decent PMIs Concerned about Coronavirus
If more cases are confirmed, prices may gap higher after the weekend.
Share this:

Outside of the United States, flash PMIs were generally better than expected with only the EU Services and Composite dragged lower by strikes in France. And although in the US, the manufacturing PMI was weaker, both the services and composite PMI’s were better. With that being said, 10-year Treasury Notes are up over 20 ticks today and stocks are currently lower. It appears that, although China is going through great lengths to contain the spread of the coronavirus, ahead of the weekend that markets aren’t taking any chances. A second case in the US was confirmed, this time in Chicago, and the markets don’t want to take any chances that more cases will be discovered over the weekend.
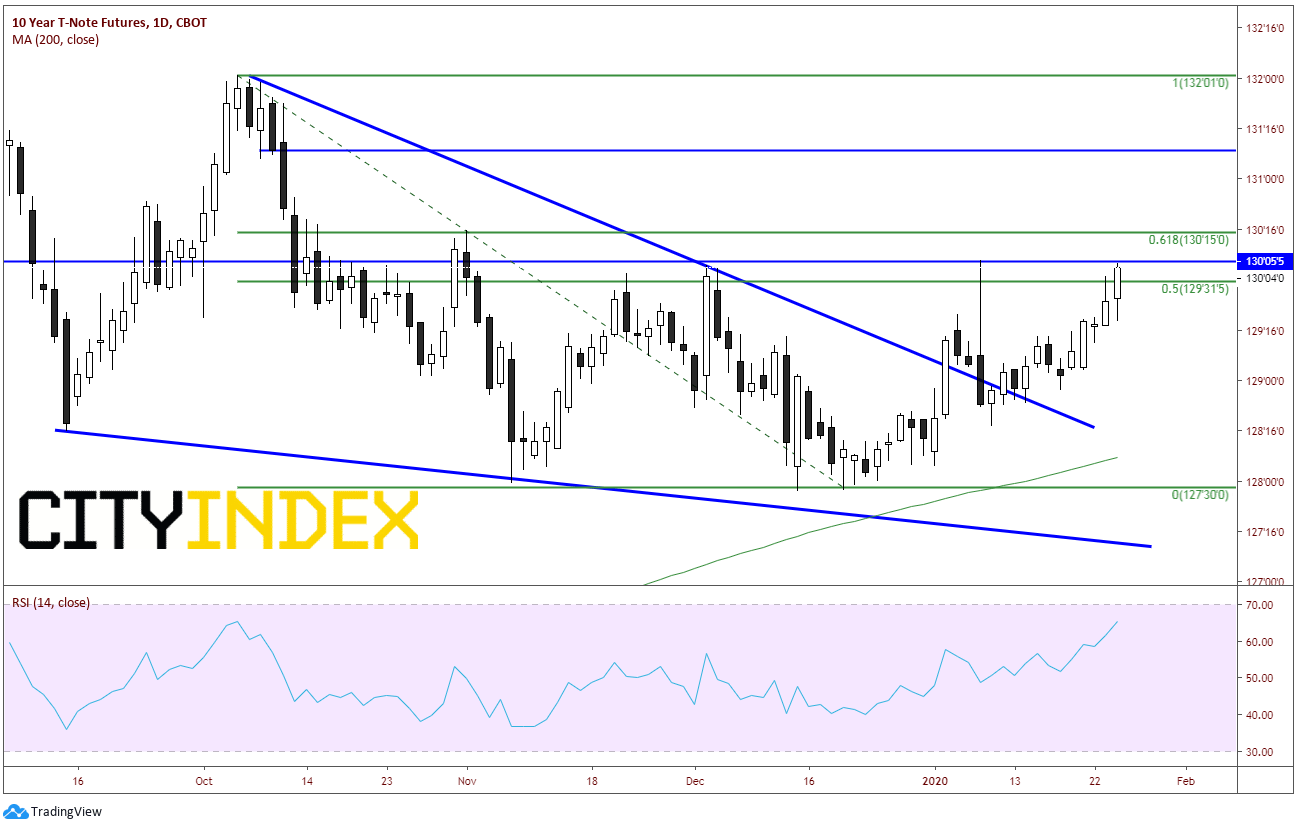
Buying bonds is considered a flight to safety. When there is uncertainty in the markets, traders sell stocks and buy bonds. The US 10-year Treasury Note has been in a falling wedge since the beginning of October 2019. Prices broke out in early January, then pulled back to retest the downward sloping trendline of the wedge on January 8th. However, the trendline held and prices are on the move higher once again. Looking at the candles on a daily timeframe, we can see that the market has been nervous this week. Including today, 10 years have closed all 5 days this week (although there is still half a trading day left today). Today, price broke through the 50% retracement from the highs on October 4th to the lows of December 19th near 130 00. It is currently testing horizontal resistance near 130 06. Above here, resistance comes across at the 61.8% retracement level near 130 15. Horizontal resistance comes across at 131 06 before reaching the October 4th highs at 132 1.
Source: Tradingview, CBOT, City Index
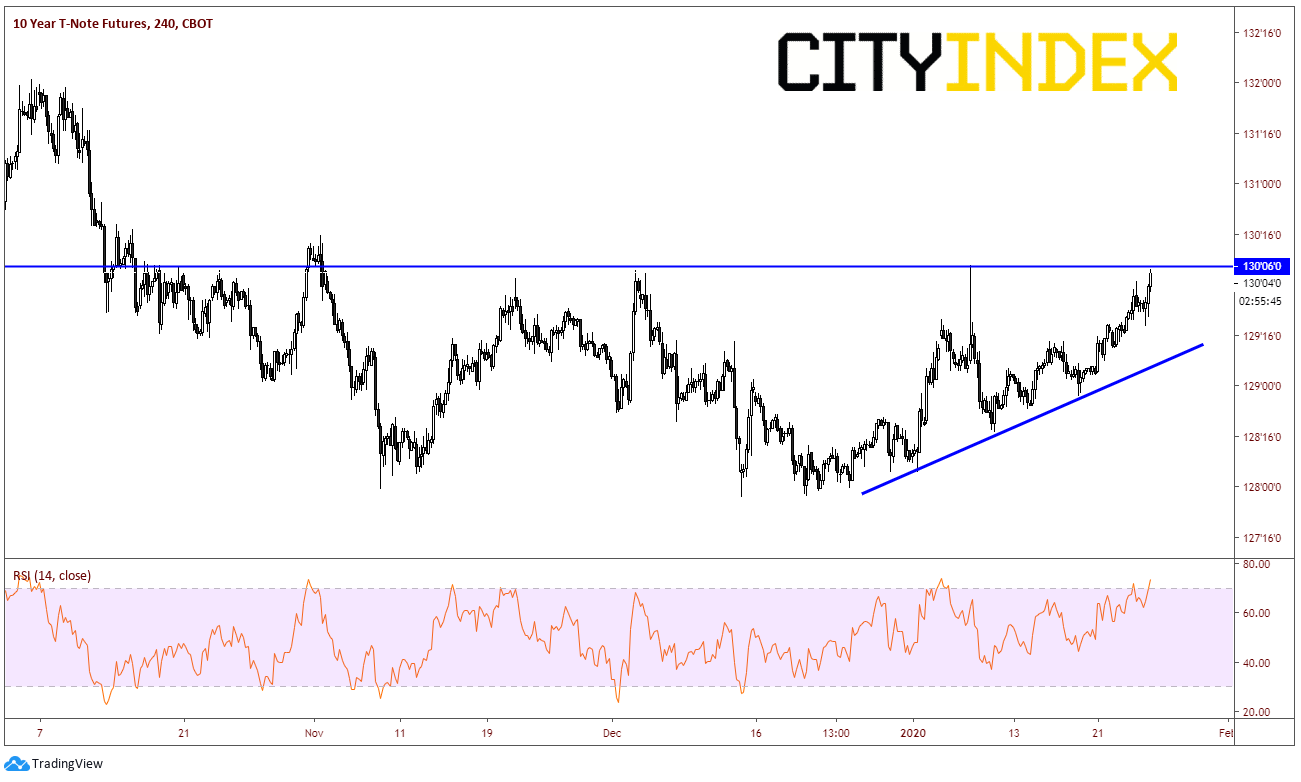
On a 240-minute timeframe, as price was moving higher this week out of the falling wedge, it formed a series of higher highs and higher lows. The trendline below is the first level of support near 129 16. (Also pay attention to the RSI, as it has moved in to overbought territory, however is not yet diverging with price). Below that is the prior low at 128 29, and then the confluence of support near the downward sloping trendline on the daily and the 200 Day Moving Average near 128 10.
Source: Tradingview, CBOT, City Index
If there is positive news over the weekend concerning the containment of the coronavirus, 10 years may very well gap open lower on the reopen Monday morning (Sunday evening in US). However, if more cases are confirmed and there doesn’t seem to be much progress in reducing exposure to the virus, prices may continue to move higher.
Outside of the United States, flash PMIs were generally better than expected with only the EU Services and Composite dragged lower by strikes in France. And although in the US, the manufacturing PMI was weaker, both the services and composite PMI’s were better. With that being said, 10-year Treasury Notes are up over 20 ticks today and stocks are currently lower. It appears that, although China is going through great lengths to contain the spread of the coronavirus, ahead of the weekend that markets aren’t taking any chances. A second case in the US was confirmed, this time in Chicago, and the markets don’t want to take any chances that more cases will be discovered over the weekend.
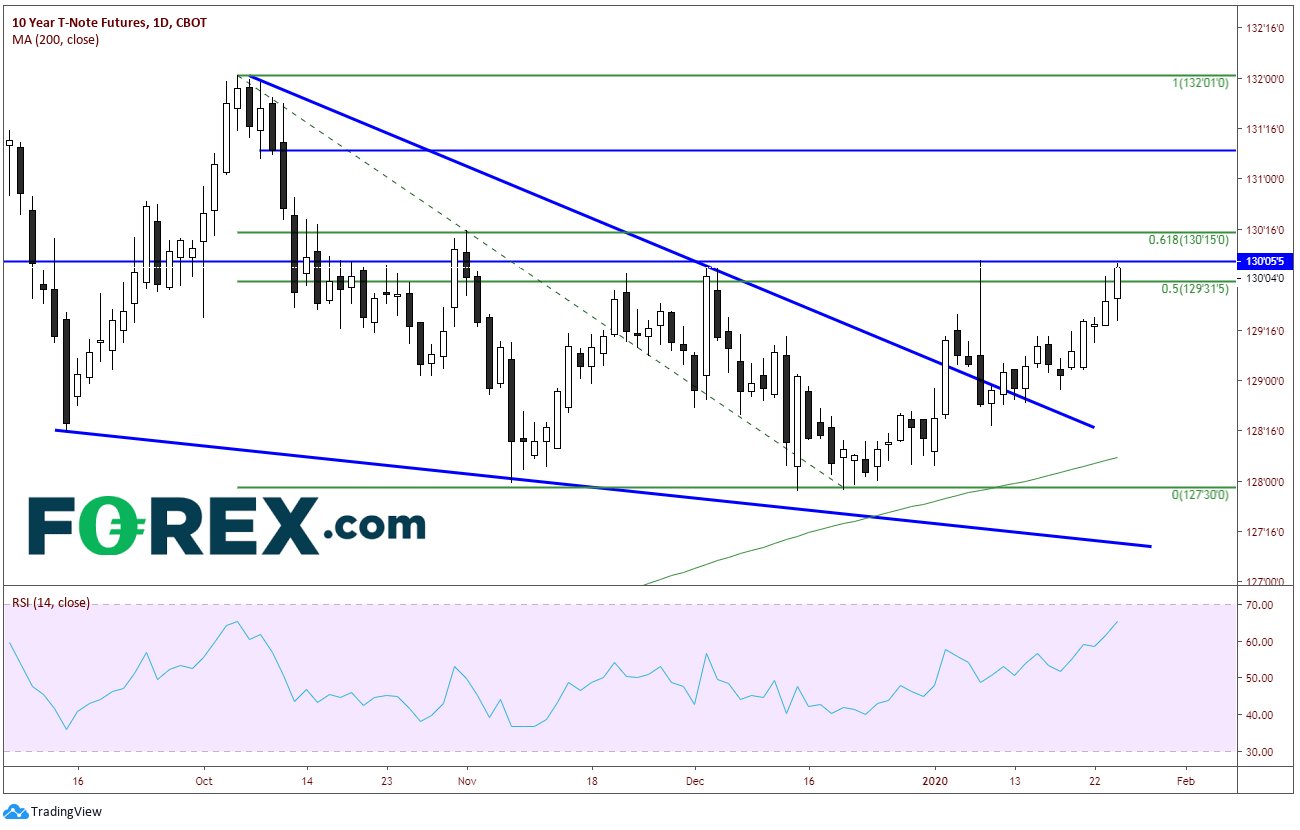
Buying bonds is considered a flight to safety. When there is uncertainty in the markets, traders sell stocks and buy bonds. The US 10-year Treasury Note has been in a falling wedge since the beginning of October 2019. Prices broke out in early January, then pulled back to retest the downward sloping trendline of the wedge on January 8th. However, the trendline held and prices are on the move higher once again. Looking at the candles on a daily timeframe, we can see that the market has been nervous this week. Including today, 10 years have closed all 5 days this week (although there is still half a trading day left today). Today, price broke through the 50% retracement from the highs on October 4th to the lows of December 19th near 130 00. It is currently testing horizontal resistance near 130 06. Above here, resistance comes across at the 61.8% retracement level near 130 15. Horizontal resistance comes across at 131 06 before reaching the October 4th highs at 132 1.
Source: Tradingview, CBOT, FOREX.com
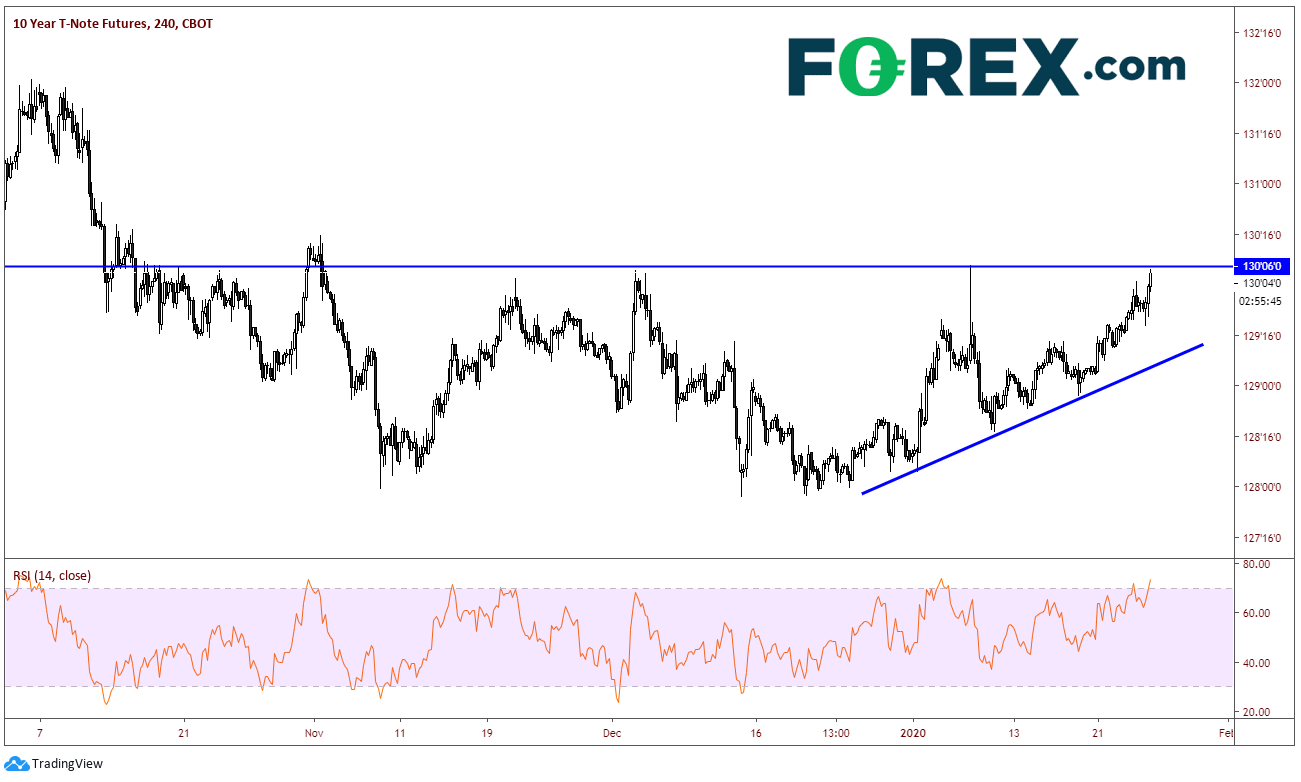
On a 240-minute timeframe, as price was moving higher this week out of the falling wedge, it formed a series of higher highs and higher lows. The trendline below is the first level of support near 129 16. (Also pay attention to the RSI, as it has moved in to overbought territory, however is not yet diverging with price). Below that is the prior low at 128 29, and then the confluence of support near the downward sloping trendline on the daily and the 200 Day Moving Average near 128 10.
Source: Tradingview, CBOT, FOREX.com
If there is positive news over the weekend concerning the containment of the coronavirus, 10 years may very well gap open lower on the reopen Monday morning (Sunday evening in US). However, if more cases are confirmed and there doesn’t seem to be much progress in reducing exposure to the virus, prices may continue to move higher.
Related tags:
Latest market news




Open an account in minutes
Experience award-winning platforms with fast and secure execution, and enjoy tight spreads from 0.5 pts on FX and 0.3 pts on indices.
Economic calendar
Web Trader platform
Our sophisticated web-based platform is packed with features.
Related articles
EUR/USD Q4 2026 Outlook: Euro at a Crossroads as Fed, ECB Tighten 9 25 2026
EUR/USD enters Q4 at a pivotal inflection point as competing Fed-ECB policy paths and persistent inflation risks collide with major technical support.

AUD/USD Q4 Outlook: RBA and Fed Hikes Set the Tone
AUD/USD enters Q4 with RBA and Fed hikes in focus as sticky inflation, rising unemployment and US dollar strength shape the Australian dollar.


USD/JPY Q4 2026 Outlook: Hawkish Fed Pricing Clashes With Intervention Risk
The year-end tug-of-war is clear: hawkish Fed pricing supports USD/JPY, while intervention risk limits the upside.

This report is intended for general circulation only. It should not be construed as a recommendation, or an offer (or solicitation of an offer) to buy or sell any financial products. The information provided does not take into account your specific investment objectives, financial situation or particular needs. Before you act on any recommendation that may be contained in this report, independent advice ought to be sought from a financial adviser regarding the suitability of the investment product, taking into account your specific investment objectives, financial situation or particular needs.
StoneX Financial Pte. Ltd., may distribute reports produced by its respective foreign entities or affiliates within the StoneX group of companies or third parties pursuant to an arrangement under Regulation 32C of the Financial Advisers Regulations. Where the report is distributed to a person in Singapore who is not an accredited investor, expert investor or an institutional investor (as defined in the Securities Futures Act), StoneX Financial Pte. Ltd. accepts legal responsibility to such persons for the contents of the report only to the extent required by law. Singapore recipients should contact StoneX Financial Pte. Ltd. at 6826 9988 for matters arising from, or in connection with the report.
In the case of all other recipients of this report, to the extent permitted by applicable laws and regulations neither StoneX Financial Pte. Ltd. nor its associated companies will be responsible or liable for any loss or damage incurred arising out of, or in connection with, any use of the information contained in this report and all such liability is hereby expressly disclaimed. No representation or warranty is made, express or implied, that the content of this report is complete or accurate.
StoneX Financial Pte. Ltd. is not under any obligation to update this report.
Trading CFDs carries a high level of risk that may not be suitable for some investors. Consider your investment objectives, level of experience, financial resources, risk appetite and other relevant circumstances carefully. The possibility exists that you could lose some or all of your investments, including your initial deposits. If in doubt, please seek independent expert advice. Visit www.forex.com/en-sg/terms-and-policies for the complete Risk Disclosure Statement.