




British Pound Technical Forecast: GBP/USD, GBP/JPY
It was a big week for the British Pound even with the Thursday rate cut from the Bank of England. For next week, the focus is on US CPI and whether USD bears can continue to push.
Share this:

British Pound Technical Forecast: GBP/USD, GBP/JPY
- It was a week of strength for the British Pound in both GBP/USD and GBP/JPY, even with the Thursday rate cut from the Bank of England.
- GBP/USD can remain an attractive venue for USD-weakness and the Dollar is in the spotlight next week with the US CPI report. In GBP/JPY, the big question is whether bulls can finally test the 200.00 psychological level that so far has remained an evasive theme.
British Pound Technical Forecast: GBP/USD
Cable was mired in a massive sell-off two weeks ago as USD strength had driven after the FOMC announcement and the Core PCE release. With the Fed not sounding so sure about near-term rate cuts and inflation in the US continuing to move-higher, there was the very real question as to whether the Fed would be able to cut this year as markets have long expected. But, the NFP report on Friday helped to bring USD-weakness back to life and that theme largely remained for much of the last week.
As I had looked at on that Friday, GBP/USD remained an attractive area to work with that USD-weakness. The 1.3145 level that had set support back in May was back in ahead of the NFP report, and that led to a vigorous bounce in the pair that held through last week’s open.
In the Tuesday webinar I looked at using that bounce and a short-term higher-high to work with bullish continuation themes, and that allowed for the build of an ascending triangle formation ahead of the Bank of England rate decision on Thursday. And even with the BoE cutting rates again, GBP/USD broke out, showing a rate cut rally as prices took out the 1.3400 level. As of this writing, the pair is working on its sixth consecutive daily gain and this is a difficult move to chase – but there is scope for support at a couple of nearby spots.
The 1.3395-1.3414 level was the zone I was using for a support bounce in mid-July. That’s now a nearby area of possible support, and below that, we have the resistance from prior support that made up the resistance side of the ascending triangle formation ahead of last week’s breakout, plotted from 1.3365-1.3371.
GBP/USD Daily Chart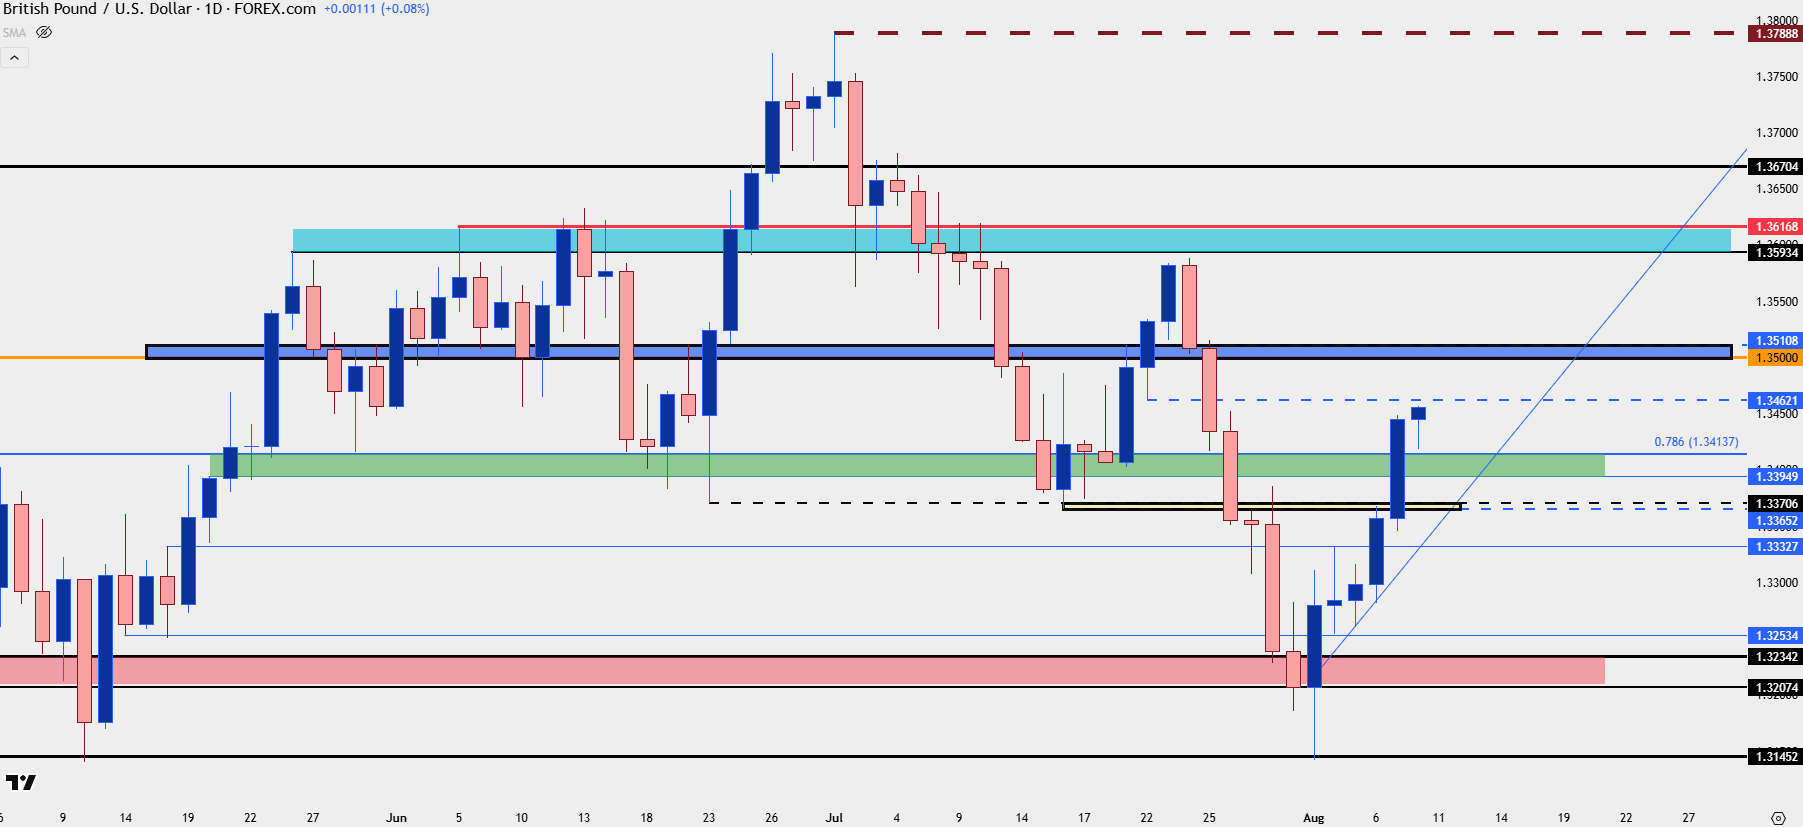
Chart prepared by James Stanley; data derived from Tradingview
British Pound Technical Forecast: GBP/JPY
Coming into the week there were legitimate concerns of larger breakdown themes in Yen-pairs. While the prior Thursday had seen a strong reaction on the back of the Bank of Japan rate decision, the rout on Friday saw GBP/JPY break through multiple supports on the way down towards the 195.00 area. I looked into that at the start of the week, and that led to a brisk four-day recovery as price jumped right back up towards the 199.00 area, with a boost from the Bank of England rate decision.
The challenge now is proximity to resistance to go along with distance away from recent swings. I’ll look at some shorter-term levels after the next chart.
GBP/JPY Daily Chart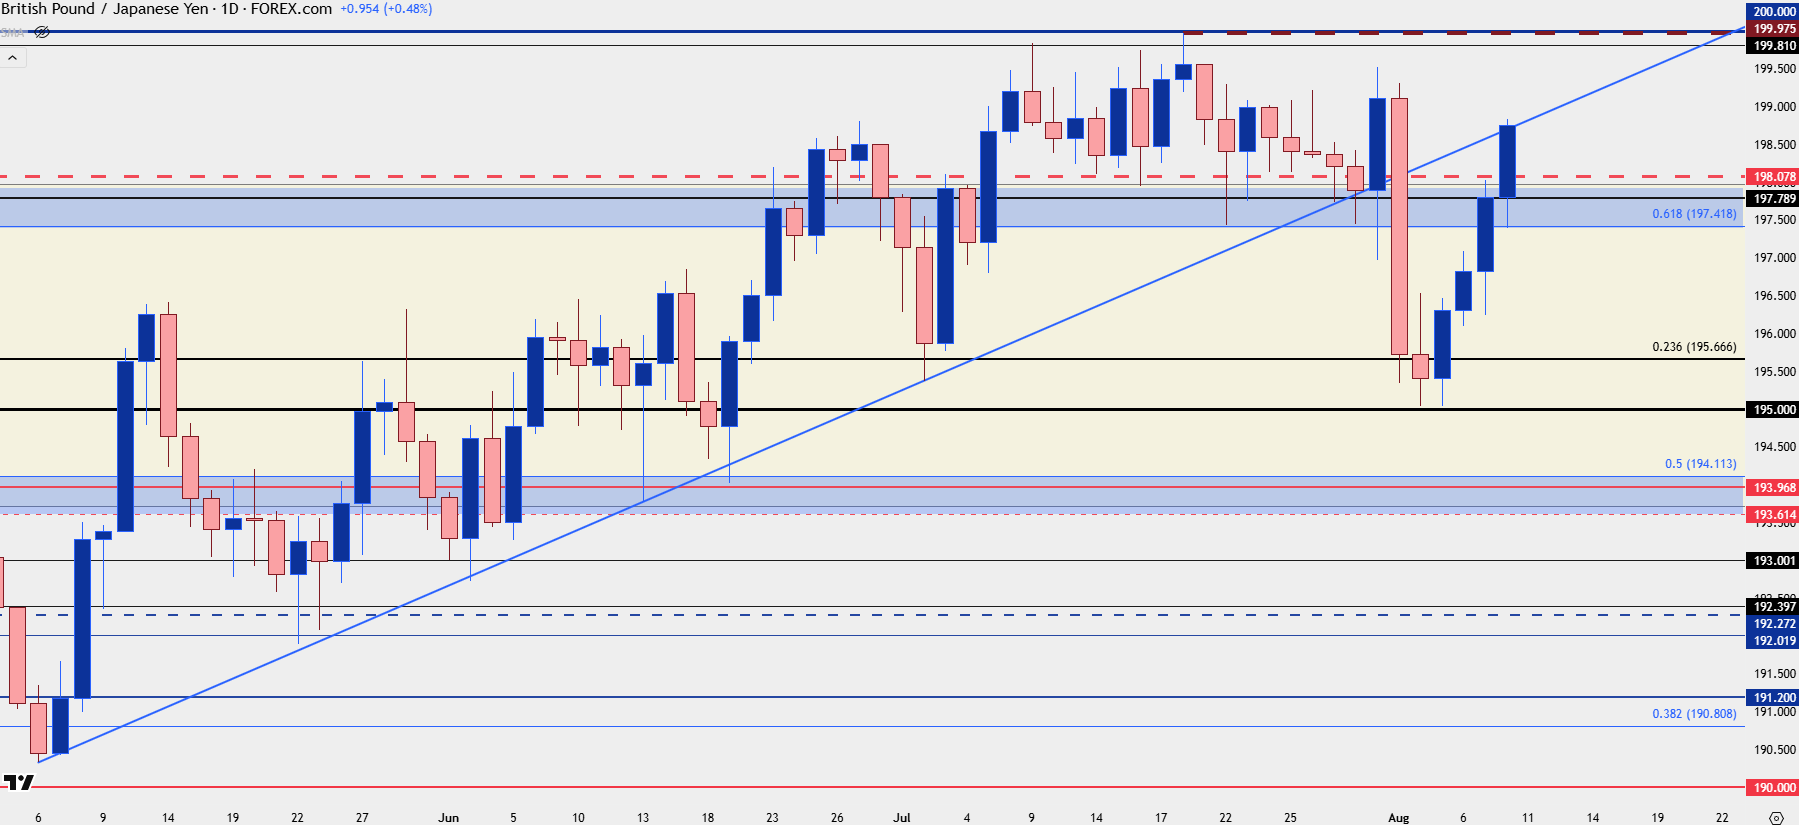
Chart prepared by James Stanley; data derived from Tradingview
GBP/JPY Shorter-Term
From the four hour chart RSI has already made a round trip over the past week, from oversold last Friday into overbought this Friday. This doesn’t necessarily mean that the pair has to reverse, but caution should be exercised given how stretched the move has already become. Instead, there’s support potential at the 198.08 level which is the top of a long-term gap, with the 197.06-197.21 level sticking out below that, as it was a spot of resistance on the way back up but hasn’t yet shown much for support since the breakout.
Below that, the 196.19-196.42 level I had looked at earlier in the week remains of interest and this is what I would currently consider as invalidation for bulls, as a breach below that will look like a failed bullish trend.
GBP/JPY Four-Hour Chart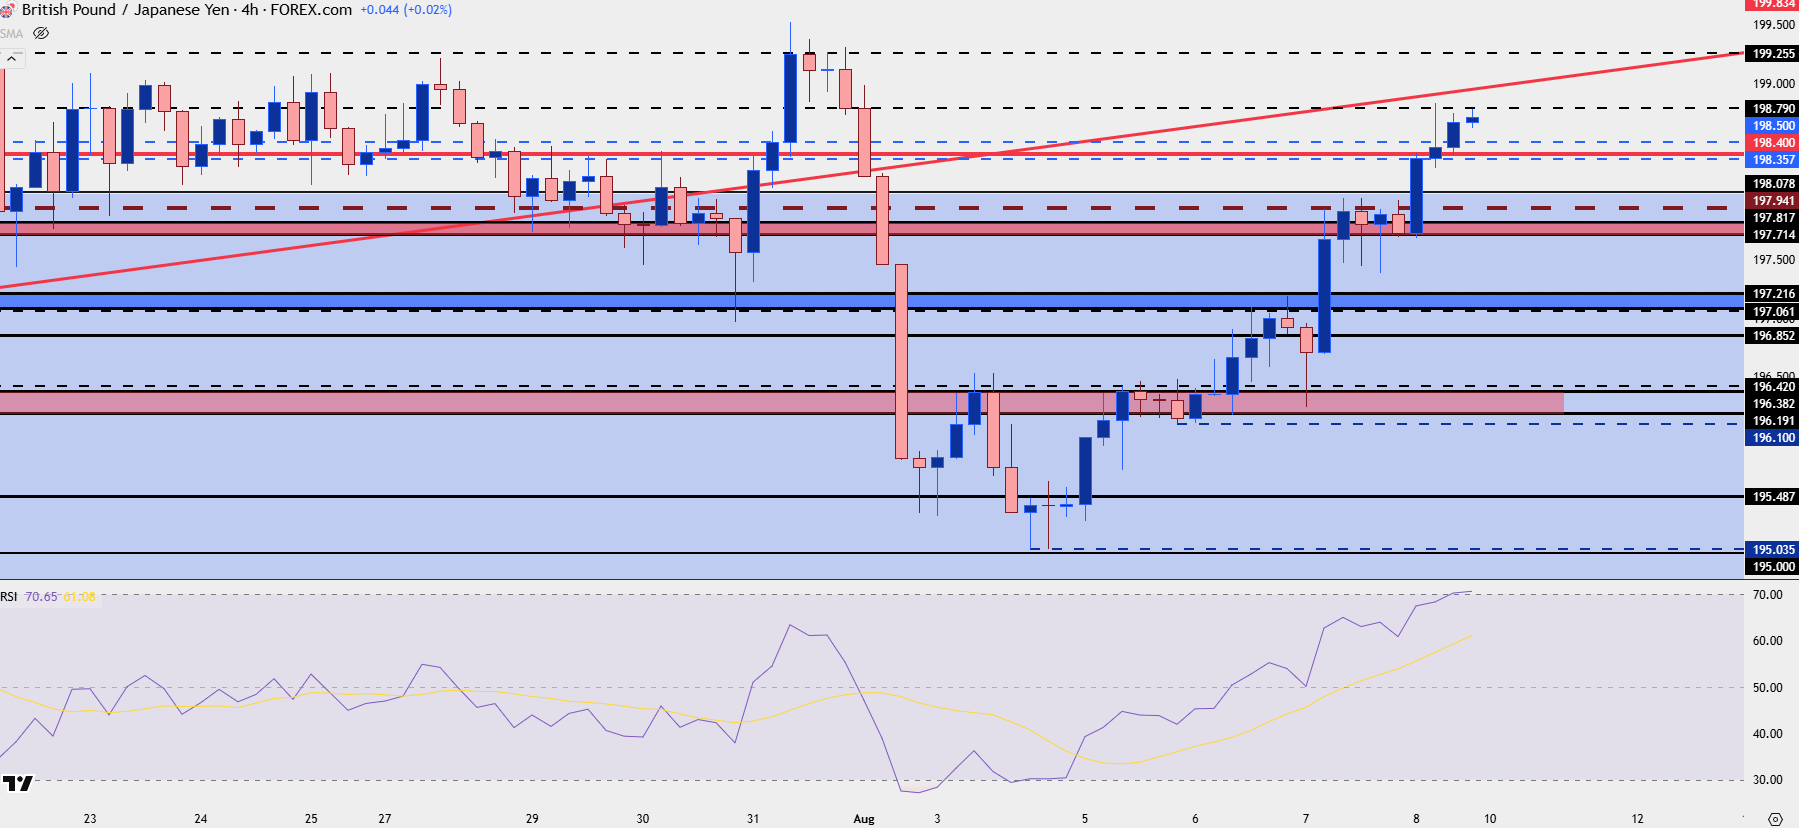
Chart prepared by James Stanley; data derived from Tradingview
--- written by James Stanley, Senior Strategist
Related tags:
Latest market news



Open an account in minutes
Experience award-winning platforms with fast and secure execution, and enjoy tight spreads from 0.5 pts on FX and 0.3 pts on indices.
Economic calendar
Web Trader platform
Our sophisticated web-based platform is packed with features.
Related articles
Gold Price Forecast: XAU/USD Avoids Breakdown as Yields Surged but Can it Continue?
Surging Treasury yields sent a jolt across markets last week but, so far, gold prices have held above the FOMC low. The big question now is whether that can continue and, if not, will bulls show up at $4100 or $4k like they did in June and July?

Equity Indices Q4, 2026 Outlook: Cracks Begin to Show
There's still an open door for a melt-up in the S&P 500 and Nasdaq but the Dow and Russell 2000 are looking more vulnerable, and until calm hits the Treasuries market there's a higher probability for volatility. The big question is whether that's a next quarter theme or not.

GBP/USD, DJIA Outlook: Support Levels Meet Oversold Risks
GBP/USD and the Dow test key support levels as rising Treasury yields, Fed rate-hike expectations and oversold momentum increase reversal risks.

This report is intended for general circulation only. It should not be construed as a recommendation, or an offer (or solicitation of an offer) to buy or sell any financial products. The information provided does not take into account your specific investment objectives, financial situation or particular needs. Before you act on any recommendation that may be contained in this report, independent advice ought to be sought from a financial adviser regarding the suitability of the investment product, taking into account your specific investment objectives, financial situation or particular needs.
StoneX Financial Pte. Ltd., may distribute reports produced by its respective foreign entities or affiliates within the StoneX group of companies or third parties pursuant to an arrangement under Regulation 32C of the Financial Advisers Regulations. Where the report is distributed to a person in Singapore who is not an accredited investor, expert investor or an institutional investor (as defined in the Securities Futures Act), StoneX Financial Pte. Ltd. accepts legal responsibility to such persons for the contents of the report only to the extent required by law. Singapore recipients should contact StoneX Financial Pte. Ltd. at 6826 9988 for matters arising from, or in connection with the report.
In the case of all other recipients of this report, to the extent permitted by applicable laws and regulations neither StoneX Financial Pte. Ltd. nor its associated companies will be responsible or liable for any loss or damage incurred arising out of, or in connection with, any use of the information contained in this report and all such liability is hereby expressly disclaimed. No representation or warranty is made, express or implied, that the content of this report is complete or accurate.
StoneX Financial Pte. Ltd. is not under any obligation to update this report.
Trading CFDs carries a high level of risk that may not be suitable for some investors. Consider your investment objectives, level of experience, financial resources, risk appetite and other relevant circumstances carefully. The possibility exists that you could lose some or all of your investments, including your initial deposits. If in doubt, please seek independent expert advice. Visit www.forex.com/en-sg/terms-and-policies for the complete Risk Disclosure Statement.