






Canada Ready with the Loaded Double Barrels
With the ammo the Bank of Canada still has left, usd/cad can run up to 1.4682.
Share this:

The Bank of Canada (BOC) did a surprise rate cut of 50 bps on Friday to bring the interest rate to 0.75%. Today, the BOC announced they are ready to adjust policy further and use all available market tools to support growth and keep inflation on target. In addition, Prime Minister Trudeau said that he is planning to bring back the House of Commons to pass emergency measures, in order to get money to their citizens! With the continued demand for the US Dollar, low oil prices, and the continued easing from Canada (with room still to go), the USD/CAD is up over 825 pips since March 6th!
What an amazing move USD/CAD has had since March 6th! On a weekly timeframe, after a false breakdown below the symmetrical triangle, price traded the opposite way and gapped higher on March 9th. Price is now significantly higher on the breakout to the topside. Resistance is at the highs from January 2016 near 1.4682. The RSI is in overbought territory and is diverging, however given the parabolic nature of the move, it should not be used as the sole decision maker for a reversal.
Source: Tradingview, City Index
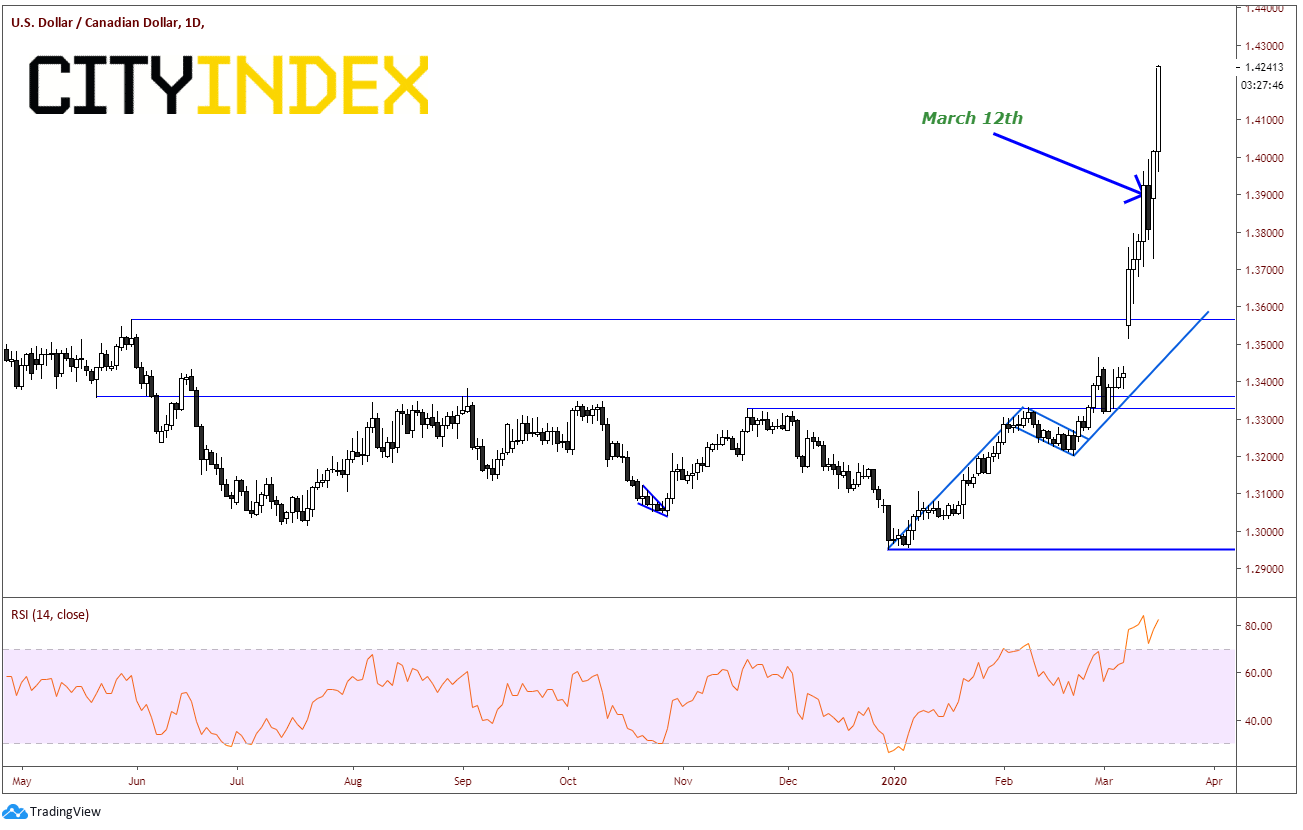
With the amount of room that the BOC still has to cut rates and continued selloff in oil, USD/CAD may continue to move higher! This is a great example of “the RSI is overbought, but in volatile one-way markets such as this, the oscillators don’t matter.” Notice how if someone has solely used the RSI as a decision maker on March 13th, and took a short USD/CAD position when it turned lower from above 80, that person would still be out of the money from that position (without a proper stop).
Source: Tradingview, City Index
On a 240-minute chart, we have a better look at the magnitude of the recent more in USD/CAD:
- January 22nd, the BOC turned dovish in their press conference and the USD/CAD moved from 1.3044 to 1.3152, roughly a 108-pip move.
- March 4th, the BOC was dovish as well, while cutting interest rates from 1.75% to 1.25%. The market moved from 1.3327 to 1.3407, roughly an 80 pip move.
- On March 6th the pair closed at 1.3420. On March 9th, the pair gapped higher to 1.3550 as Saudi Arabi announced that they will increase output to counter Russia’s oil output. Price continued to today’s highs near 1.4245, roughly 825 pips higher.
Source: Tradingview, City Index
As I mentioned earlier, resistance isn’t until 1.4682 on the weekly. There is shorter term support at 1.4017 and 1.4000. Below that, support is the 38.2% retracement from the March 9th low to today’s highs, near 1.3970. Also, the 50% retracement level confluences with the rising trendline near 1.3884.
Source: Tradingview, City Index
Although USD/CAD can pull back, with all the ammo the Bank of Canada still has left, it wouldn’t be unusual for the pair to run up and test the prior highs near 1.4682.
The Bank of Canada (BOC) did a surprise rate cut of 50 bps on Friday to bring the interest rate to 0.75%. Today, the BOC announced they are ready to adjust policy further and use all available market tools to support growth and keep inflation on target. In addition, Prime Minister Trudeau said that he is planning to bring back the House of Commons to pass emergency measures, in order to get money to their citizens! With the continued demand for the US Dollar, low oil prices, and the continued easing from Canada (with room still to go), the USD/CAD is up over 825 pips since March 6th!
What an amazing move USD/CAD has had since March 6th! On a weekly timeframe, after a false breakdown below the symmetrical triangle, price traded the opposite way and gapped higher on March 9th. Price is now significantly higher on the breakout to the topside. Resistance is at the highs from January 2016 near 1.4682. The RSI is in overbought territory and is diverging, however given the parabolic nature of the move, it should not be used as the sole decision maker for a reversal.
Source: Tradingview, FOREX.com
With the amount of room that the BOC still has to cut rates and continued selloff in oil, USD/CAD may continue to move higher! This is a great example of “the RSI is overbought, but in volatile one-way markets such as this, the oscillators don’t matter.” Notice how if someone has solely used the RSI as a decision maker on March 13th, and took a short USD/CAD position when it turned lower from above 80, that person would still be out of the money from that position (without a proper stop).
Source: Tradingview, FOREX.com
On a 240-minute chart, we have a better look at the magnitude of the recent more in USD/CAD:
- January 22nd, the BOC turned dovish in their press conference and the USD/CAD moved from 1.3044 to 1.3152, roughly a 108-pip move.
- March 4th, the BOC was dovish as well, while cutting interest rates from 1.75% to 1.25%. The market moved from 1.3327 to 1.3407, roughly an 80 pip move.
- On March 6th the pair closed at 1.3420. On March 9th, the pair gapped higher to 1.3550 as Saudi Arabi announced that they will increase output to counter Russia’s oil output. Price continued to today’s highs near 1.4245, roughly 825 pips higher.
Source: Tradingview, FOREX.com
As I mentioned earlier, resistance isn’t until 1.4682 on the weekly. There is shorter term support at 1.4017 and 1.4000. Below that, support is the 38.2% retracement from the March 9th low to today’s highs, near 1.3970. Also, the 50% retracement level confluences with the rising trendline near 1.3884.
Source: Tradingview, FOREX.com
Although USD/CAD can pull back, with all the ammo the Bank of Canada still has left, it wouldn’t be unusual for the pair to run up and test the prior highs near 1.4682.
Latest market news




Open an account in minutes
Experience award-winning platforms with fast and secure execution, and enjoy tight spreads from 0.5 pts on FX and 0.3 pts on indices.
Economic calendar
Web Trader platform
Our sophisticated web-based platform is packed with features.
Related articles

EUR/USD, USD/JPY Outlook: Oil, yields and an FX identity crisis
Crude oil is setting the tone across rates and FX, leaving EUR/USD vulnerable and USD/JPY caught between higher Treasury yields and the growing threat of intervention


Nasdaq 100 Forecast: NDX falls as oil jumps and Treasury yields rise
U.S. stocks are pointing to a weaker open on Monday after President Trump rejected an Iranian ceasefire, sending oil prices higher and fuelling inflationary concerns and pushing Treasury yields higher.


Crude Oil Q4 2026 Outlook: Will a New Energy-Security Regime Emerge?
Crude Oil Q4 2026 Outlook: The U.S.-Iran conflict has done more than disrupt oil flows. It has challenged many of the assumptions underpinning the global energy security system established after the 1973 oil embargo.

This report is intended for general circulation only. It should not be construed as a recommendation, or an offer (or solicitation of an offer) to buy or sell any financial products. The information provided does not take into account your specific investment objectives, financial situation or particular needs. Before you act on any recommendation that may be contained in this report, independent advice ought to be sought from a financial adviser regarding the suitability of the investment product, taking into account your specific investment objectives, financial situation or particular needs.
StoneX Financial Pte. Ltd., may distribute reports produced by its respective foreign entities or affiliates within the StoneX group of companies or third parties pursuant to an arrangement under Regulation 32C of the Financial Advisers Regulations. Where the report is distributed to a person in Singapore who is not an accredited investor, expert investor or an institutional investor (as defined in the Securities Futures Act), StoneX Financial Pte. Ltd. accepts legal responsibility to such persons for the contents of the report only to the extent required by law. Singapore recipients should contact StoneX Financial Pte. Ltd. at 6826 9988 for matters arising from, or in connection with the report.
In the case of all other recipients of this report, to the extent permitted by applicable laws and regulations neither StoneX Financial Pte. Ltd. nor its associated companies will be responsible or liable for any loss or damage incurred arising out of, or in connection with, any use of the information contained in this report and all such liability is hereby expressly disclaimed. No representation or warranty is made, express or implied, that the content of this report is complete or accurate.
StoneX Financial Pte. Ltd. is not under any obligation to update this report.
Trading CFDs carries a high level of risk that may not be suitable for some investors. Consider your investment objectives, level of experience, financial resources, risk appetite and other relevant circumstances carefully. The possibility exists that you could lose some or all of your investments, including your initial deposits. If in doubt, please seek independent expert advice. Visit www.forex.com/en-sg/terms-and-policies for the complete Risk Disclosure Statement.