





Canadian Dollar Forecast: USD/CAD Tanks into the Big Picture Range
USD/CAD is working on its largest sell-off in more than four years and the pair is back in the long-term range that’s been in-play since 2016.
Share this:

Canadian Dollar, USD/CAD Talking Points:
- USD/CAD has posted its largest sell-off since 2020 as the pair has pushed below the psychologically important 1.4000 handle and back into the big picture range.
- It probably seemed unthinkable in early-February when the pair pushed a fresh 20-plus year high, but bulls continually failed at 1.4500 and that lasted long enough for sellers to take over, continuing the nine-year pattern of mean reversion in the pair.
- Markets remain volatile but if you’re reading this you probably already knew that. In this article I look at a couple of different ways of working with the current backdrop in the USD/CAD pair.
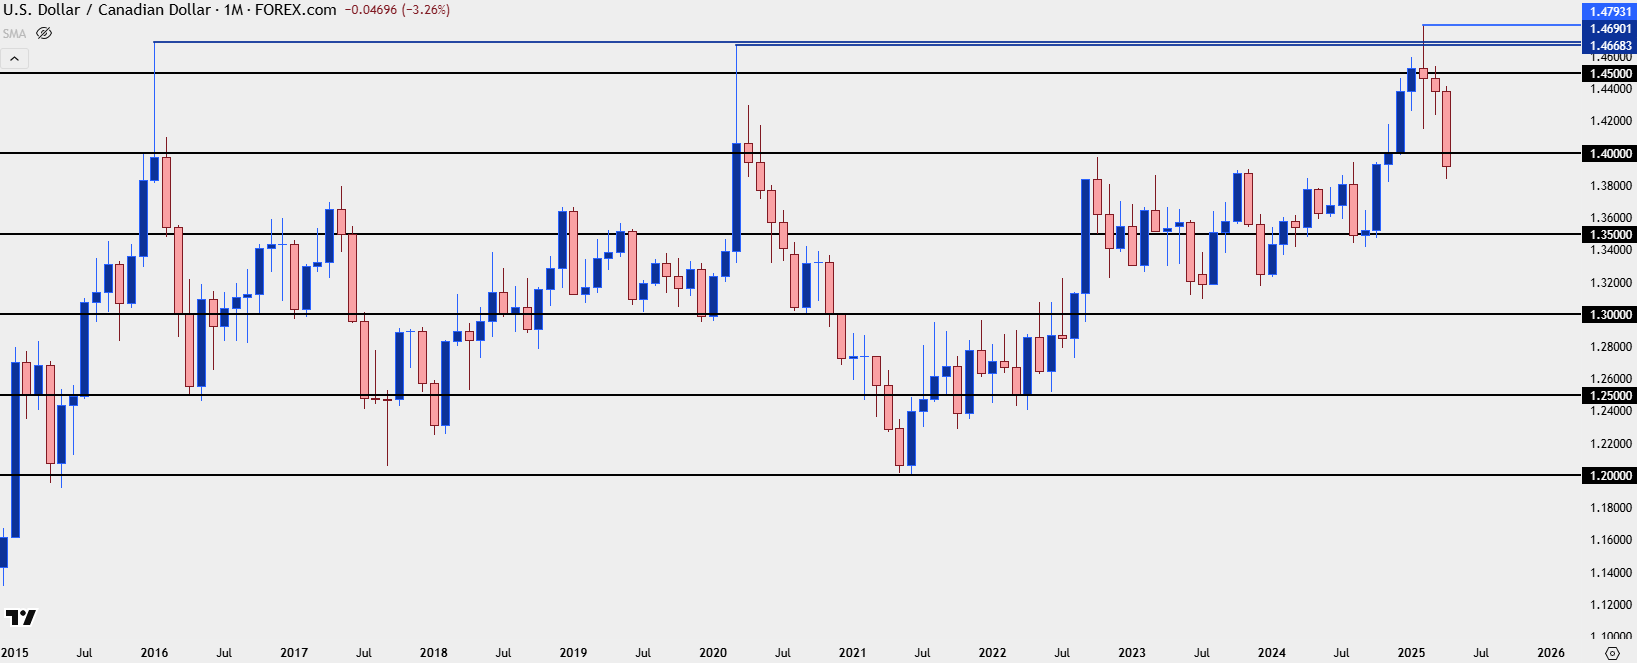
If tracking it from the monthly chart it looks somewhat clean, but on shorter-term basis the USD/CAD pair has been quite chaotic through the first three months and change of 2025 trade.
The pair started to trend higher last year as President-elect Trump began to talk up tariffs on Canada. It was messy but there was certainly intent there, and the initial breakout was somewhat tenuous. But as the verbiage persisted the 1.4000 level that bulls previously didn’t want to test started to show as support, and that led to a continued trend into the end of 2024 and the first month of 2025.
The 1.4500 level was first tested the day after Trump’s inauguration, but it couldn’t hold. Tariffs at that point were opaque as Trump had initially said that they’d be imposed on ‘day one’ of his presidency, but when it became clear that wasn’t the case the pair recoiled down to support. Trump then said February 1st and that’s where the tension seemed to climax. Feb 1st was a Saturday, and on that Sunday open confusion reigned supreme and USD/CAD broke out aggressively, although the move couldn’t hold. By early-Monday morning another delay was announced and the pair pulled back again. But March was still a go at that point and USD/CAD pushed up to 1.4500 early in the month, only for buyers to fail again.
Collectively, this produced a spinning top (or perhaps a long-legged doji, depending on how you qualify such formations) on the monthly chart. As I had opined after the March open this kept the door open for bigger-picture mean reversion, and then the rest of March showed a tepid move with 1.4500 remaining as resistance.
But so far this month sellers have taken over in a big way and USD/CAD has now pushed below the psychologically important 1.4000 level, indicating continuation of the longer-term range in the pair.
USD/CAD Monthly Price Chart
USD/CAD Weekly
The big item so far this week is that bears have taken an important step that they seemed unwilling to commit to even a week ago. While the lower-highs were fairly clear with respect of the 1.4500 handle, sellers weren’t able to hold on to lower-lows. There was a test last week, but a late-week bounce left an extended underside wick.
This week, however, that has not been a problem as broad-based USD-selling has taken over. Sellers have so far pushed a lower-low down to the 1.3846 swing. While RSI isn’t quite oversold on the daily chart as of this writing, it’s still a tough move to chase given how much distance has shown on the weekly bar, but it can highlight attractiveness behind a trend that could open the door for lower-high resistance in effort of tracking continuation.
USD/CAD Weekly Chart
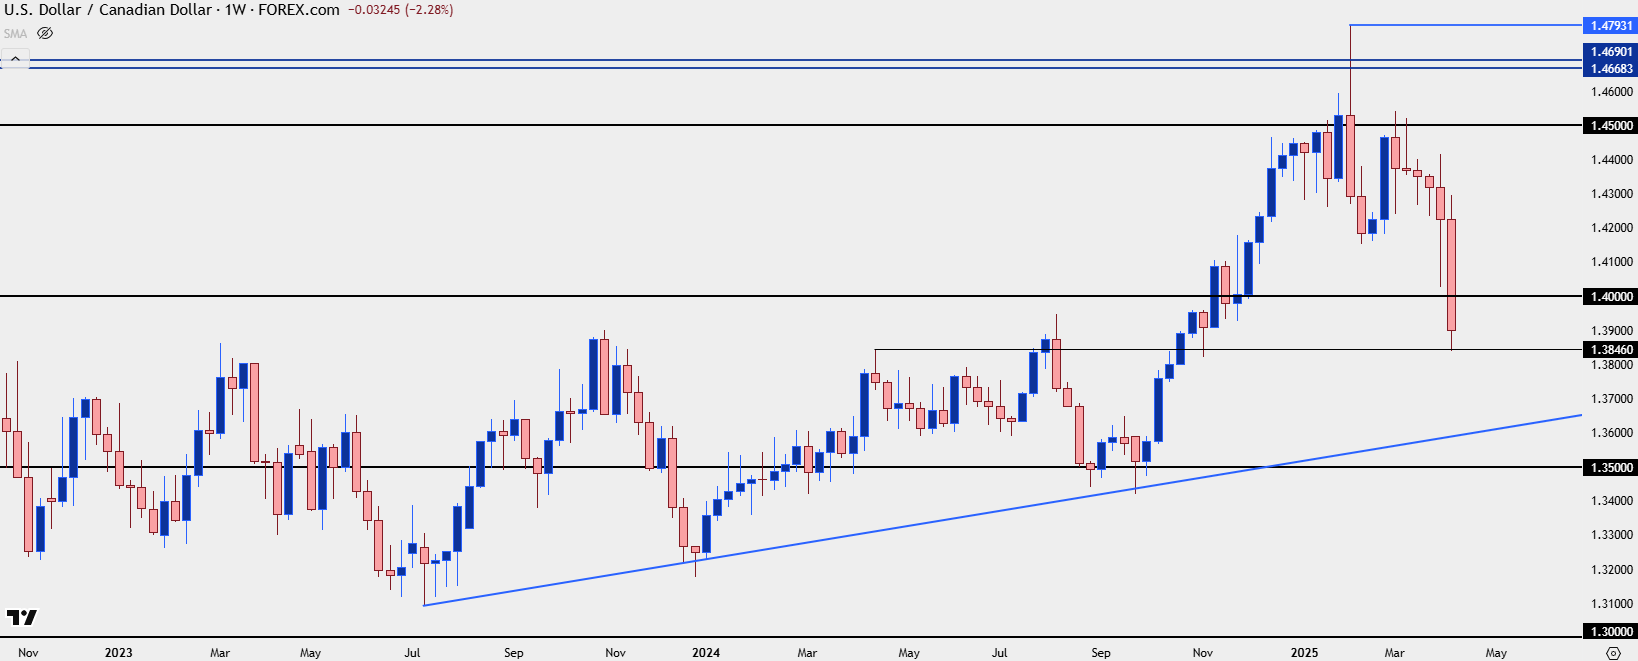 Chart prepared by James Stanley; data derived from Tradingview
USD/CAD Daily
If that longer-term range is going to continue there could be considerable downside left to be seen. But it can also be difficult to set risk levels on a trade that’s already seen the market sell-off by more than 360 pips from the week’s high.
From the daily chart, we can get a couple of additional items that could assist with bearish approaches, key of which is the 1.4000 psychological level which I’ll touch on in a moment. Above that is a zone of resistance-turned-support around the 1.4151 level and that becomes a secondary area of resistance potential.
The complication with 1.4000 is just how obvious that is for a point of reference. If we employ a bit of game theory, we can imagine that sellers might already be anticipating that, to the point where they may come in early to defend the big figure. So, ideally, for bearish continuation approaches we would see some degree of anticipation from bears that would disallow a test through that 1.4000 handle. I’ve marked 1.3981 on the below chart as it was a nearby swing of reference that could suffice for such a purpose.
But, even if 1.4000 does trade, that doesn’t mean price has to go up to the 1.4150 zone, as you can see from the multiple instances of resistance at 1.4500 on the below daily chart in March, those wick reactions highlight intra-day reversals after failed tests of the big figure and something of that nature could certainly remain of interest in USD/CAD for next week.
USD/CAD Daily Price Chart
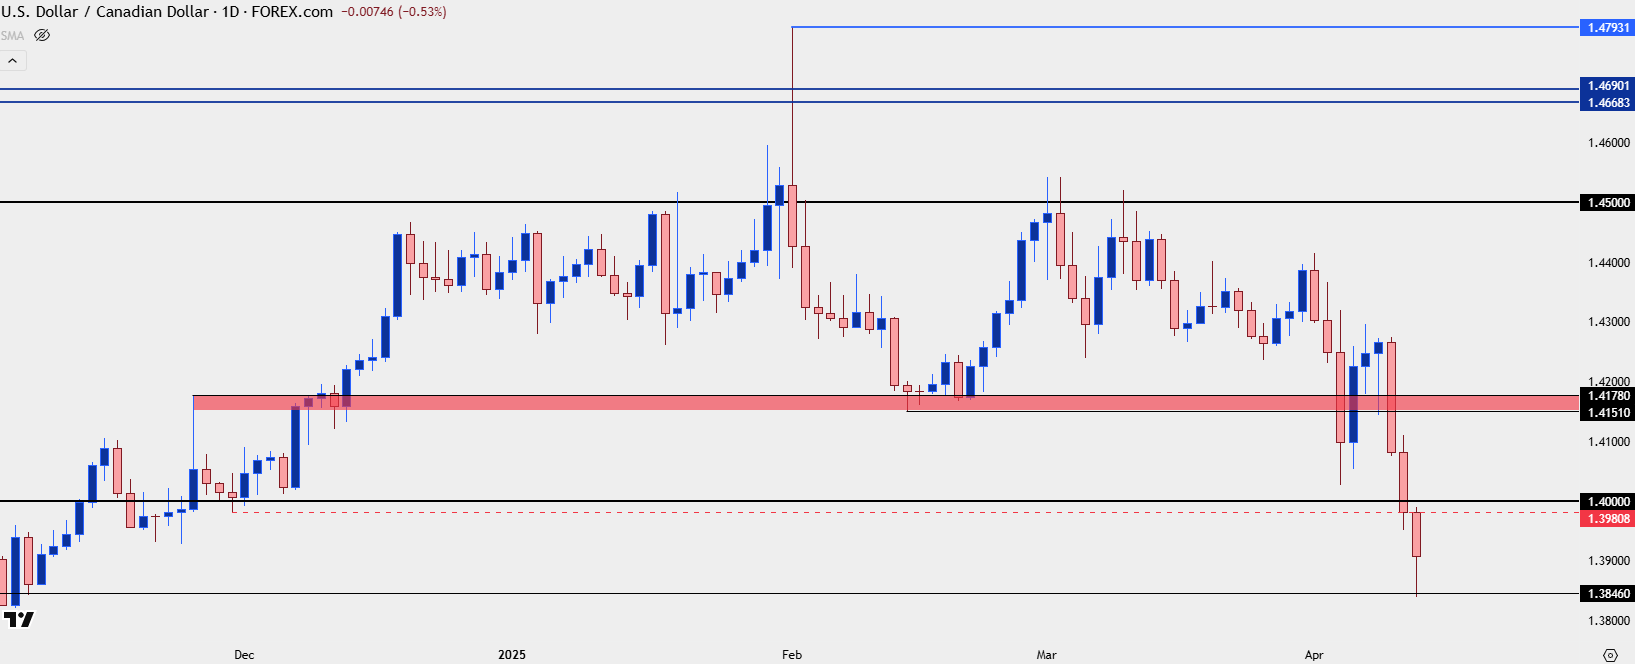 Chart prepared by James Stanley; data derived from Tradingview
--- written by James Stanley, Senior Strategist
Canadian Dollar, USD/CAD Talking Points:
- USD/CAD has posted its largest sell-off since 2020 as the pair has pushed below the psychologically important 1.4000 handle and back into the big picture range.
- It probably seemed unthinkable in early-February when the pair pushed a fresh 20-plus year high, but bulls continually failed at 1.4500 and that lasted long enough for sellers to take over, continuing the nine-year pattern of mean reversion in the pair.
- Markets remain volatile but if you’re reading this you probably already knew that. In this article I look at a couple of different ways of working with the current backdrop in the USD/CAD pair.
If tracking it from the monthly chart it looks somewhat clean, but on shorter-term basis the USD/CAD pair has been quite chaotic through the first three months and change of 2025 trade.
The pair started to trend higher last year as President-elect Trump began to talk up tariffs on Canada. It was messy but there was certainly intent there, and the initial breakout was somewhat tenuous. But as the verbiage persisted the 1.4000 level that bulls previously didn’t want to test started to show as support, and that led to a continued trend into the end of 2024 and the first month of 2025.
The 1.4500 level was first tested the day after Trump’s inauguration, but it couldn’t hold. Tariffs at that point were opaque as Trump had initially said that they’d be imposed on ‘day one’ of his presidency, but when it became clear that wasn’t the case the pair recoiled down to support. Trump then said February 1st and that’s where the tension seemed to climax. Feb 1st was a Saturday, and on that Sunday open confusion reigned supreme and USD/CAD broke out aggressively, although the move couldn’t hold. By early-Monday morning another delay was announced and the pair pulled back again. But March was still a go at that point and USD/CAD pushed up to 1.4500 early in the month, only for buyers to fail again.
Collectively, this produced a spinning top (or perhaps a long-legged doji, depending on how you qualify such formations) on the monthly chart. As I had opined after the March open this kept the door open for bigger-picture mean reversion, and then the rest of March showed a tepid move with 1.4500 remaining as resistance.
But so far this month sellers have taken over in a big way and USD/CAD has now pushed below the psychologically important 1.4000 level, indicating continuation of the longer-term range in the pair.
USD/CAD Monthly Price Chart
Chart prepared by James Stanley; data derived from Tradingview
USD/CAD Weekly
The big item so far this week is that bears have taken an important step that they seemed unwilling to commit to even a week ago. While the lower-highs were fairly clear with respect of the 1.4500 handle, sellers weren’t able to hold on to lower-lows. There was a test last week, but a late-week bounce left an extended underside wick.
This week, however, that has not been a problem as broad-based USD-selling has taken over. Sellers have so far pushed a lower-low down to the 1.3846 swing. While RSI isn’t quite oversold on the daily chart as of this writing, it’s still a tough move to chase given how much distance has shown on the weekly bar, but it can highlight attractiveness behind a trend that could open the door for lower-high resistance in effort of tracking continuation.
USD/CAD Weekly Chart
USD/CAD Daily
If that longer-term range is going to continue there could be considerable downside left to be seen. But it can also be difficult to set risk levels on a trade that’s already seen the market sell-off by more than 360 pips from the week’s high.
From the daily chart, we can get a couple of additional items that could assist with bearish approaches, key of which is the 1.4000 psychological level which I’ll touch on in a moment. Above that is a zone of resistance-turned-support around the 1.4151 level and that becomes a secondary area of resistance potential.
The complication with 1.4000 is just how obvious that is for a point of reference. If we employ a bit of game theory, we can imagine that sellers might already be anticipating that, to the point where they may come in early to defend the big figure. So, ideally, for bearish continuation approaches we would see some degree of anticipation from bears that would disallow a test through that 1.4000 handle. I’ve marked 1.3981 on the below chart as it was a nearby swing of reference that could suffice for such a purpose.
But, even if 1.4000 does trade, that doesn’t mean price has to go up to the 1.4150 zone, as you can see from the multiple instances of resistance at 1.4500 on the below daily chart in March, those wick reactions highlight intra-day reversals after failed tests of the big figure and something of that nature could certainly remain of interest in USD/CAD for next week.
USD/CAD Daily Price Chart
--- written by James Stanley, Senior Strategist




Open an account in minutes
Experience award-winning platforms with fast and secure execution, and enjoy tight spreads from 0.5 pts on FX and 0.3 pts on indices.
Economic calendar
Web Trader platform
Our sophisticated web-based platform is packed with features.
Related articles

Japanese Yen Technical Analysis: USD/JPY Support Test into Core PCE
USD/JPY has been a battlefield for the past two months as the force of intervention and the threat of more have given sellers an advantage, even as buyers have continued to bid support on pullbacks. This sets the stage for a massive finish to the week with Core PCE and Non-farm Payrolls.

Euro Forecast: EUR/USD Tumbles Towards Yearly Low as Daily RSI Goes Oversold
EUR/USD has been hit hard in the final month of the quarter as USD strength has shown up in a big way. With the pair set to challenge its yearly low as RSI has pushed into oversold territory, is there a chance for a pullback with some big headline risk hitting in the US over the next few days?

AUD/USD outlook: Aussie slips despite hawkish RBA ahead of key data
The AUD/USD was unable to benefit from the Reserve Bank of Australia’s 25-basis-point rate hike overnight. The RBA lifted the cash rate to 4.60%, in line with expectations. However, the Australian dollar weakened following the decision, with much of the Bank’s hawkish stance seemingly priced in ahead of the announcement. The US dollar has also remained largely supported following the recent turmoil in the bond markets.

This report is intended for general circulation only. It should not be construed as a recommendation, or an offer (or solicitation of an offer) to buy or sell any financial products. The information provided does not take into account your specific investment objectives, financial situation or particular needs. Before you act on any recommendation that may be contained in this report, independent advice ought to be sought from a financial adviser regarding the suitability of the investment product, taking into account your specific investment objectives, financial situation or particular needs.
StoneX Financial Pte. Ltd., may distribute reports produced by its respective foreign entities or affiliates within the StoneX group of companies or third parties pursuant to an arrangement under Regulation 32C of the Financial Advisers Regulations. Where the report is distributed to a person in Singapore who is not an accredited investor, expert investor or an institutional investor (as defined in the Securities Futures Act), StoneX Financial Pte. Ltd. accepts legal responsibility to such persons for the contents of the report only to the extent required by law. Singapore recipients should contact StoneX Financial Pte. Ltd. at 6826 9988 for matters arising from, or in connection with the report.
In the case of all other recipients of this report, to the extent permitted by applicable laws and regulations neither StoneX Financial Pte. Ltd. nor its associated companies will be responsible or liable for any loss or damage incurred arising out of, or in connection with, any use of the information contained in this report and all such liability is hereby expressly disclaimed. No representation or warranty is made, express or implied, that the content of this report is complete or accurate.
StoneX Financial Pte. Ltd. is not under any obligation to update this report.
Trading CFDs carries a high level of risk that may not be suitable for some investors. Consider your investment objectives, level of experience, financial resources, risk appetite and other relevant circumstances carefully. The possibility exists that you could lose some or all of your investments, including your initial deposits. If in doubt, please seek independent expert advice. Visit www.forex.com/en-sg/terms-and-policies for the complete Risk Disclosure Statement.