








Canadian Dollar Outlook: USD/CAD slips into trouble as spreads implode
U.S. inflation data is missing to the downside at a pace not seen in years, with markets responding by pricing in more cuts from the Fed. That’s hitting USD/CAD hard, breaking long-held support and leaving the trend vulnerable to further downside—unless oversold conditions trigger a snapback.
Share this:

USD/CAD Summary
Softer U.S. inflation reads have reignited the case for the Federal Reserve to resume its easing cycle, working in tandem with strong demand for Treasuries to see yield spreads between the United States and Canada narrow sharply. For the first time in months, that’s been a powerful force behind recent U.S. dollar movements, contributing to USD/CAD breaking several key technical levels on Thursday.
U.S. Inflation Undershoots Surge
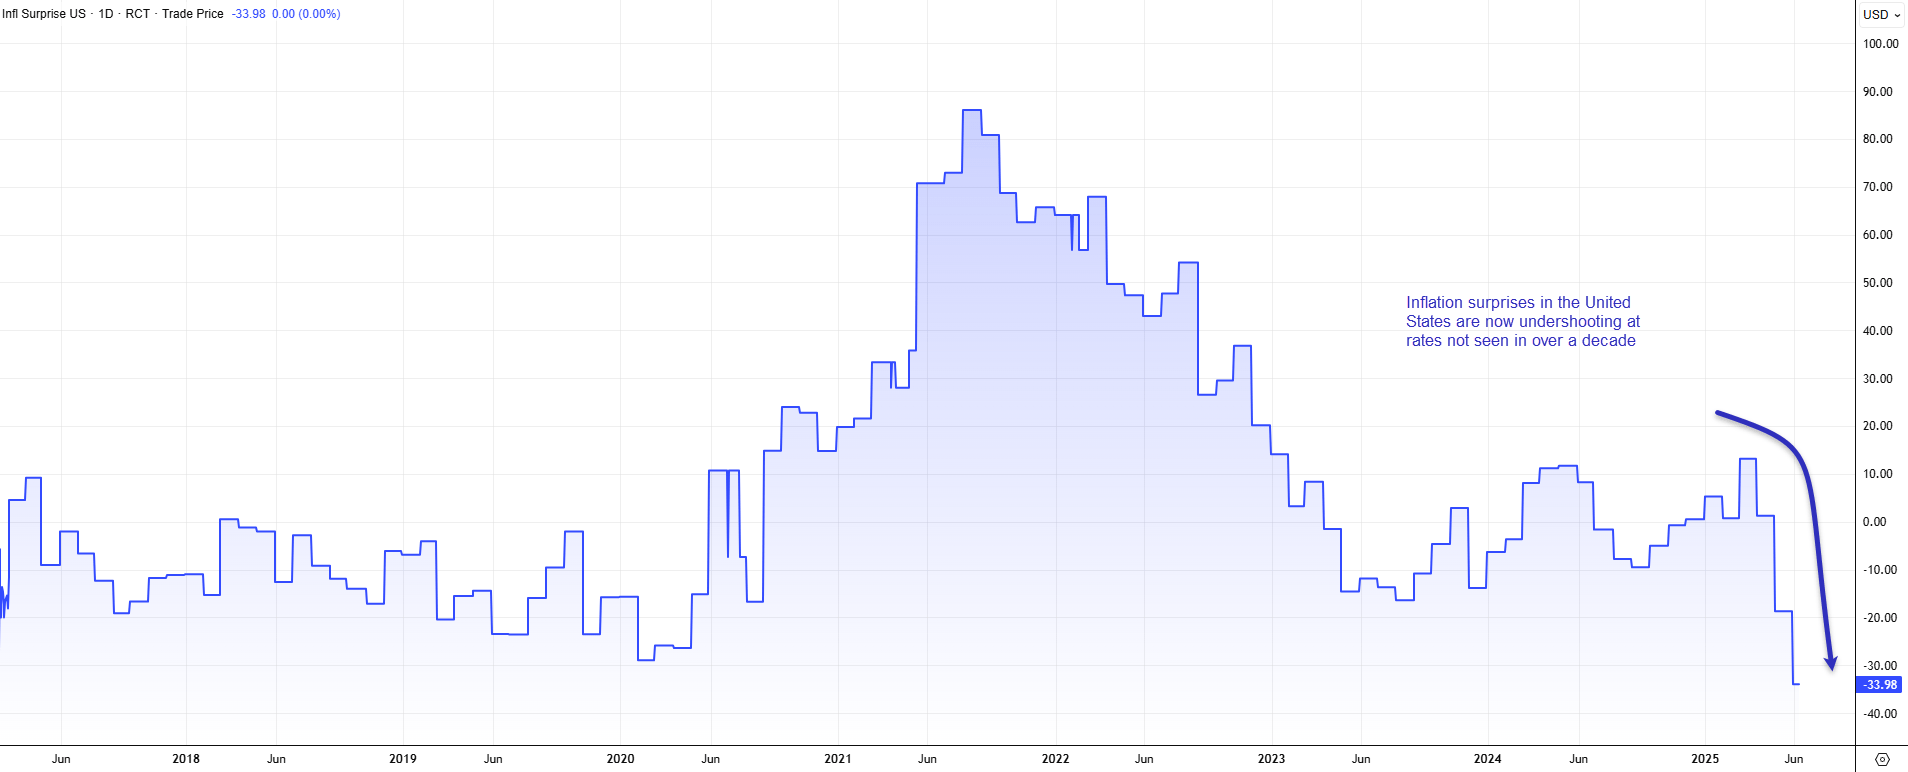
Federal Reserve officials may be reluctant to act upon it yet, but inflation data in the United States is now undershooting on the downside at rates not seen in over a decade—a period when central banks were purposely running loose monetary policy settings to help spur on price pressures.
Source: TradingView
Citi’s U.S. economic surprise index—which tracks how inflation readings print relative to forecasts—has fallen off a cliff in recent months, likely reflecting a combination of limited passthrough of import tariffs, along with signs of weakening price pressures in services which may reflect softer labour market conditions.
Market-based inflation expectations have shifted to reflect the weak inflationary pulse, with five and 10-year inflation swaps—tracking expectations for annual inflation rates over those periods—tumbling 50 and 25 basis points respectively from the highs seen in February. Even though they both remain above the Fed’s 2% inflation target, given the current trajectory, that may not remain the case for long. So far, there’s been scant evidence of recent U.S. tariff increases showing up in the data.
U.S. Yields Tumble, Bonds Bid
Short-end rates traders are becoming alert to the risk that inflation may not accelerate as many previously expected, with pricing for rate cuts from the Federal Reserve this year moving to over two full 25bp cuts, up 15bp this week alone following the release of soft CPI and PPI data for May.
Source: TradingView
Combined with strong demand at recent U.S. Treasury auctions for 10 and 30-year debt, it’s resulted in significant declines in U.S. bond yields across the curve, seeing yield differentials with other major nations narrow sharply, including Canada. That can be seen above, with yield spreads between U.S. and Canadian bonds compressing significantly, in part because of reduced expectations for continued rate cuts from the Bank of Canada.
U.S.-Canada Yield Spreads Implode
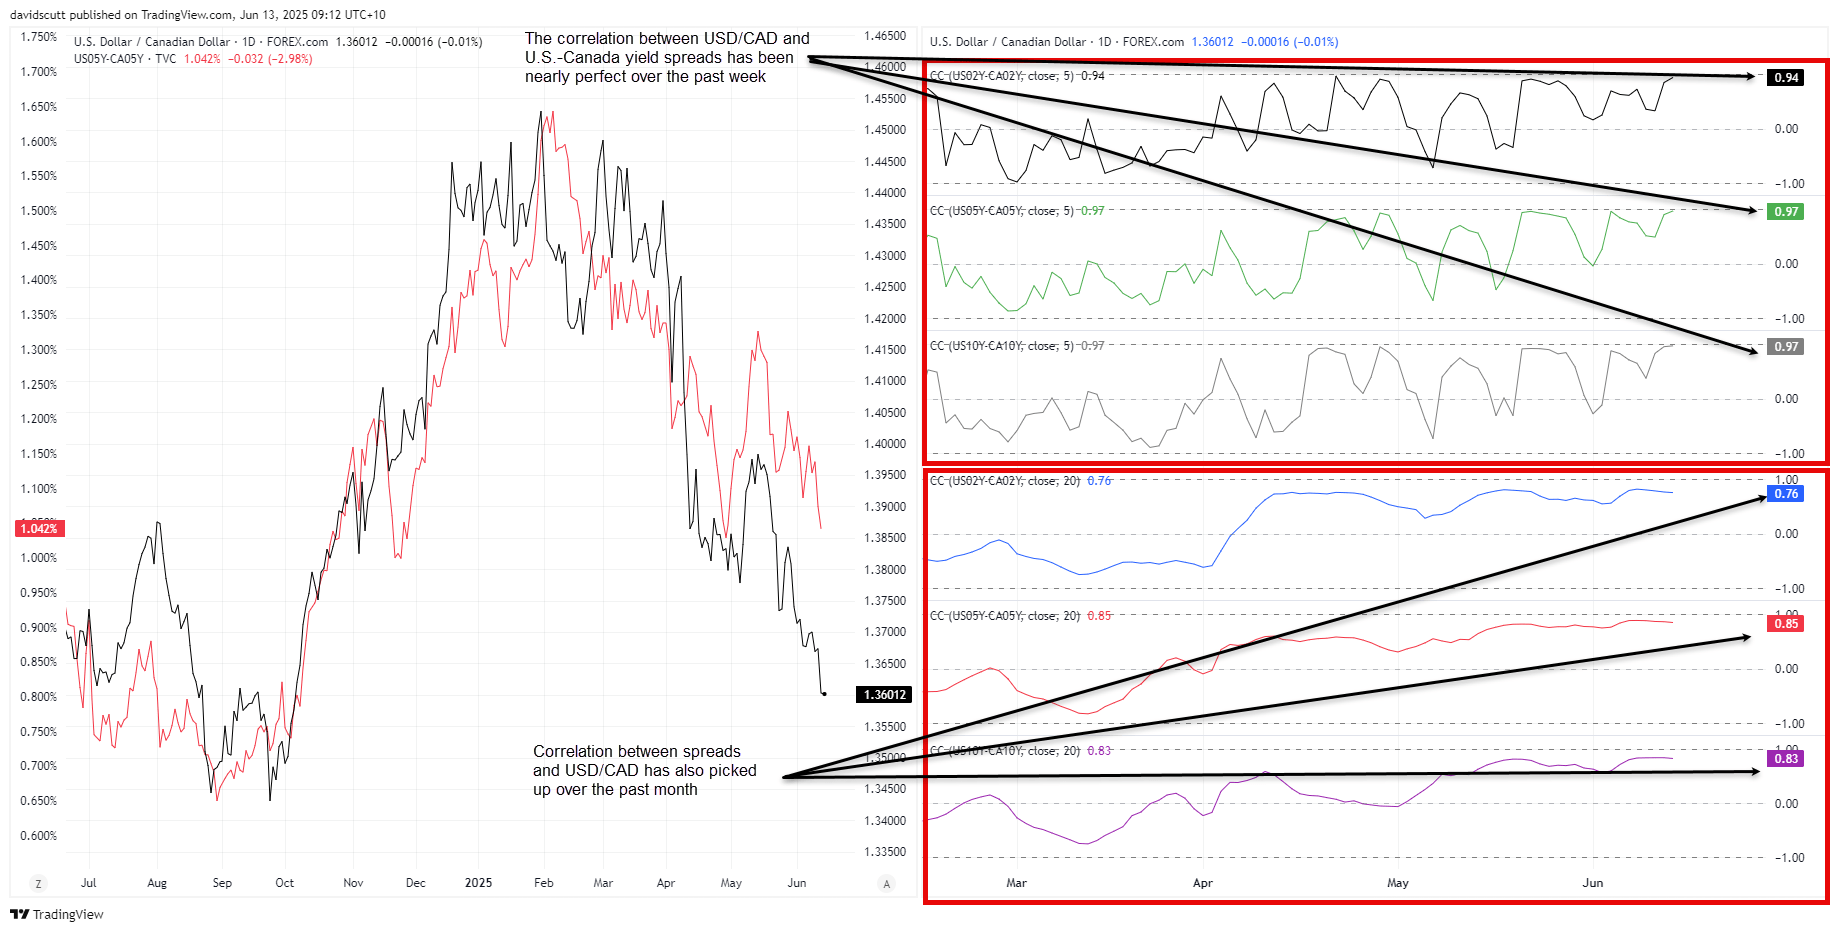
As seen below, that compression has been a major force behind recent weakness in USD/CAD, with its correlation with two, five and 10-year spreads strengthening noticeably over the past month, especially the past week where the relationship has been nearly perfect. For the first time in a while, rate differentials matter for the U.S. dollar.
Source: TradingView
USD/CAD Cracks Key Support Zone
Considering the yield compression between the two nations’ debt, and its strong relationship with USD movements recently, it comes as no surprise that we’ve seen some serious technical damage done in USD/CAD this week.
Having prodded and probed the support zone on several occasions over the past week, USD/CAD bears finally found the courage to test the waters below 1.3650 on Thursday, an important development considering it also saw the price take out long-running uptrend support dating back to December 2023.
Source: TradingView
So far, the bearish move stalled at 1.3600—another level the price has done ample work either side of going back several years. It’s often been tested but rarely crossed, making what happens next potentially important following the uptrend break of Thursday.
If the move continues, 1.3550 is the next downside level to keep on the radar having provided support and resistance in September last year. Beyond, 1.3420 looms as a more substantial test for bears.
While the price remains in a solid downtrend from the highs set in May, you could make the argument that it now sits in a falling wedge pattern, hinting a countertrend move may arrive in the not-too-distant future. That’s relevant at a time when RSI (14) sits in oversold territory, another indicator that squeeze risk may be building. More broadly, the momentum picture remains entirely bearish at this stage, favouring selling rallies.
On the topside, the confluence of horizontal support at 1.3650, former uptrend support and downtrend resistance from the May highs would provide a significant test for bulls if and when it’s tested. If the price were able to break and close above that zone, it would invalidate the bearish bias, putting a potential retest of 1.3750 on the table.
Upcoming Event Risk
Looking ahead, next Wednesday’s U.S. FOMC interest rate decision will be a key event given the influence rate differentials have had on recent USD/CAD movements. With little risk ascribed to a change in the funds rate, it will likely come down to the Fed’s updated dot plot to drive market direction, remembering at the last meeting the median forecast looked for two rate cuts this year. Given recent data flow, arguably, the risk may be the median forecast shifts more dovish on this occasion. Jerome Powell’s post meeting presser will also be important for massaging market messaging.
On the data front, the key releases will be retail sales figures from both the United States and Canada.
-- Written by David Scutt
Follow David on Twitter @scutty
How to trade with City Index
You can trade with City Index by following these four easy steps:
- Open an account, or log in if you’re already a customer
• Open an account in the UK
• Open an account in Australia
• Open an account in Singapore
- Search for the market you want to trade in our award-winning platform
- Choose your position and size, and your stop and limit levels
- Place the trade
Related tags:

Open an account in minutes
Experience award-winning platforms with fast and secure execution, and enjoy tight spreads from 0.5 pts on FX and 0.3 pts on indices.
Economic calendar
Web Trader platform
Our sophisticated web-based platform is packed with features.
Related articles

Gold forecast: XAU/USD could take a larger dive after the big rise in yields
Gold prices have been falling in the last few days after last week’s post-FOMC pop faded amid rising interest rate expectations, higher oil prices and a strengthening US dollar. As before, I wasn’t convinced gold would thrive in the current macro backdrop.


USD/JPY outlook: Hawkish Fed recalibration pressures the yen
Stronger US growth momentum and rising Treasury yields are keeping USD/JPY pointed higher, even as Japanese policymakers try to limit the pressure building across domestic markets.

Gold, silver slammed as hawkish Fed repricing reignites dollar upside
Gold and silver had held up surprisingly well against surging US yields. Wednesday’s DXY breakout may have changed that equation.
This report is intended for general circulation only. It should not be construed as a recommendation, or an offer (or solicitation of an offer) to buy or sell any financial products. The information provided does not take into account your specific investment objectives, financial situation or particular needs. Before you act on any recommendation that may be contained in this report, independent advice ought to be sought from a financial adviser regarding the suitability of the investment product, taking into account your specific investment objectives, financial situation or particular needs.
StoneX Financial Pte. Ltd., may distribute reports produced by its respective foreign entities or affiliates within the StoneX group of companies or third parties pursuant to an arrangement under Regulation 32C of the Financial Advisers Regulations. Where the report is distributed to a person in Singapore who is not an accredited investor, expert investor or an institutional investor (as defined in the Securities Futures Act), StoneX Financial Pte. Ltd. accepts legal responsibility to such persons for the contents of the report only to the extent required by law. Singapore recipients should contact StoneX Financial Pte. Ltd. at 6826 9988 for matters arising from, or in connection with the report.
In the case of all other recipients of this report, to the extent permitted by applicable laws and regulations neither StoneX Financial Pte. Ltd. nor its associated companies will be responsible or liable for any loss or damage incurred arising out of, or in connection with, any use of the information contained in this report and all such liability is hereby expressly disclaimed. No representation or warranty is made, express or implied, that the content of this report is complete or accurate.
StoneX Financial Pte. Ltd. is not under any obligation to update this report.
Trading CFDs carries a high level of risk that may not be suitable for some investors. Consider your investment objectives, level of experience, financial resources, risk appetite and other relevant circumstances carefully. The possibility exists that you could lose some or all of your investments, including your initial deposits. If in doubt, please seek independent expert advice. Visit www.forex.com/en-sg/terms-and-policies for the complete Risk Disclosure Statement.