




Crude Oil Outlook: 4-Year Support vs OPEC December Decision
Crude Oil Outlook: With several challenges facing OPEC’s meeting today, crude oil’s 4-year support zone remains pivotal in determining its next move—will it result in a bearish breakout or a bullish reversal?
Share this:

Key Events
- Trump’s “Drill Baby Drill” Agenda: Aims to increase oil output by 3 million barrels.
- OPEC’s Market Share Risks: Faces potential oversupply from US production.
- Output Expectations: Speculation grows over holding current production levels instead of a previously anticipated hike.
- Revenue vs. Price Risks: OPEC members weigh revenue potential against price stability.
- Geopolitical Tensions: Risks persist for 2024, with Trump warning of action in the Middle East if resolutions aren’t reached before his presidency.
In his latest statements, Trump promised a painful attack for the Middle East if a resolution was not settled by the time his presidency term begins. The following statement underscores potential upside risks for oil prices, particularly as they remain supported within the $64–$68 zone, established since December 2021.
Downside Risks:
OPEC decisions face potential downside risks for oil prices in 2025, driven by:
- Demand Revisions: A fourth consecutive downward revision for oil demand forecasts.
- China’s Economic Slowdown: Stimulus measures have yet to show significant impact.
- Compliance Breaches: Quotas breached to address economic pressures, particularly in Russia.
- Shift Toward Renewables: Growing adoption of renewable energy further challenges demand.
- Trump’s Oversupply Risks: The "Drill Baby Drill" agenda and plans to increase US oil output by 3 million barrels threaten to flood the market, further pressuring OPEC’s market share and oil price forecasts for 2025.
Technical Analysis: Quantifying Uncertainties
Crude Oil Outlook: 3 Month Time Frame – Log Scale 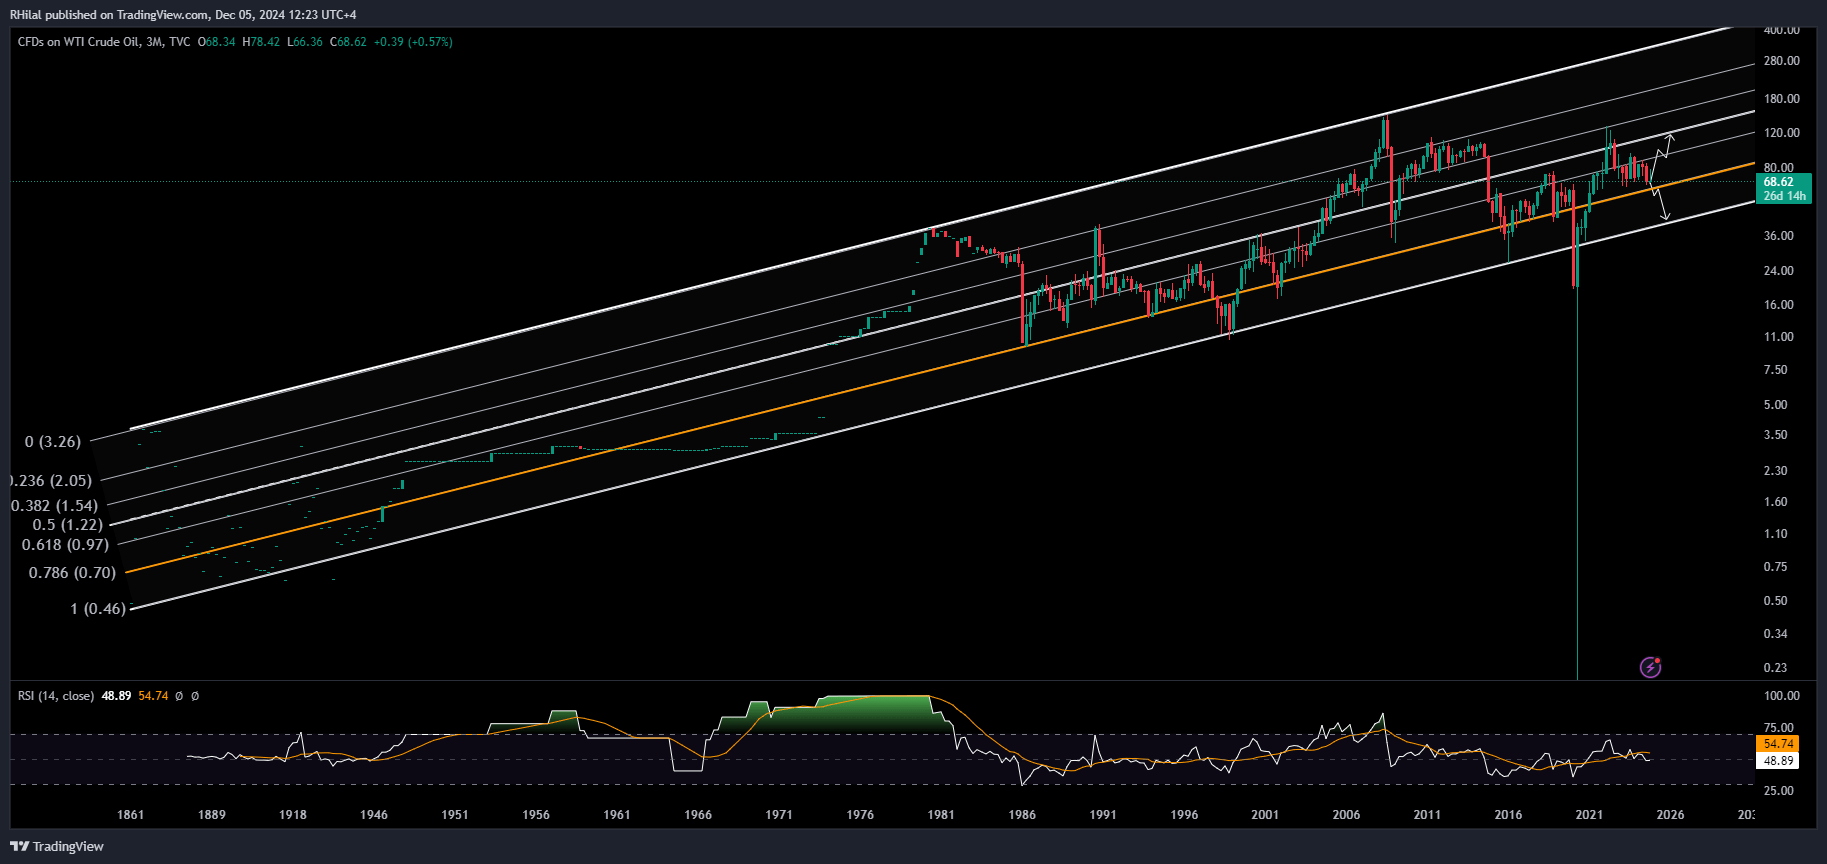
Source: Tradingview
Zooming out to the historical trend on oil prices since the lows of the 1800s, a clear up trending channel is still respected.
Applying Fibonacci analysis to the historical trend
- The 50% Fibonacci mid-channel level serves as a significant resistance point, aligning with the September 2022 highs near the $100 per barrel checkpoint.
- The 0.382 Fibonacci level corresponds to the $128 per barrel high, marking another key resistance level.
- The $64 support aligns with the 0.786 Fibonacci level, providing a critical support zone for the trend.
The channel’s lower boundary, breached only during COVID-19, suggests a potential support zone near $49. From a momentum indicator perspective, the 3-month RSI is retesting neutral levels, clarifying the solid support zone between a steep bearish breakout and another bullish rebound.
Dropping towards more recent time frames and patterns
Crude Oil Outlook: Weekly Time Frame – Log Scale
Source: Tradingview
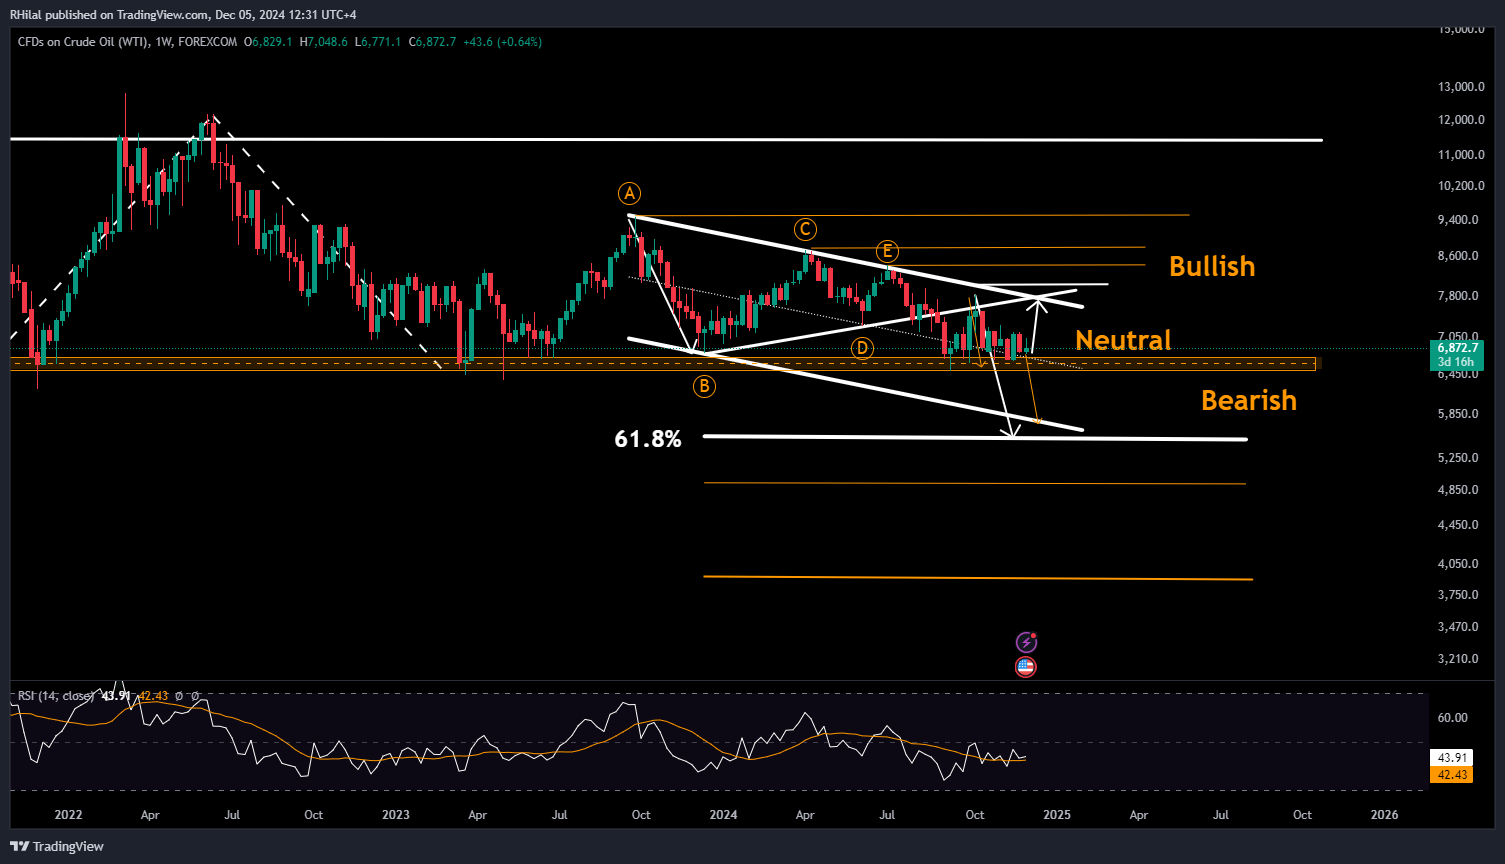
The minor consolidation below the yearlong triangle and above the 4-year support is still extending shoulders, and the strength of the current support presents two scenarios accordingly.
Scenario 1: The bearish breakout from the triangle suggests a move toward the full triangle target, aligning with the 0.618 Fibonacci retracement level of the 2020–2022 uptrend at 55. This scenario also aligns with the lower boundary of the down-trending channel, which has been respected and extended from the yearlong triangle pattern. A firm break below 64 can extend the drop towards 58 and 55.
Scenario 2: If the current support zone holds and bullish fundamentals come into play, the first resistance could be met at the triangle’s thrust point (where its borders converge) near $78. Further resistance levels could follow at $80, $84, and $88, potentially extending the uptrend toward longer-term targets at $95 and $120.
--- Written by Razan Hilal, CMT on X: @Rh_waves and Forex.com You tube Channel
Latest market news




Open an account in minutes
Experience award-winning platforms with fast and secure execution, and enjoy tight spreads from 0.5 pts on FX and 0.3 pts on indices.
Economic calendar
Web Trader platform
Our sophisticated web-based platform is packed with features.
Related articles

S&P 500 Forecast: SPX rises after cooler-than-expected inflation data
U.S. stocks are rising and Treasury yields are falling after data showed that inflation increased at a cooler pace than expected, while U.S. consumer spending rose again in August.


Treasury Yields Lose Momentum as Energy ETF Retreats
The 10-year Treasury yield is testing a resistance zone respected since the 1920s, as bearish RSI divergence signals fading upside momentum.

GBP/USD, Oil Forecast: Two trades to watch 300926
GBP/USD: Can Stronger UK Growth Offset the Dollar’s Advantage? Oil: Supply Recovery Challenges the Geopolitical Premium.
This report is intended for general circulation only. It should not be construed as a recommendation, or an offer (or solicitation of an offer) to buy or sell any financial products. The information provided does not take into account your specific investment objectives, financial situation or particular needs. Before you act on any recommendation that may be contained in this report, independent advice ought to be sought from a financial adviser regarding the suitability of the investment product, taking into account your specific investment objectives, financial situation or particular needs.
StoneX Financial Pte. Ltd., may distribute reports produced by its respective foreign entities or affiliates within the StoneX group of companies or third parties pursuant to an arrangement under Regulation 32C of the Financial Advisers Regulations. Where the report is distributed to a person in Singapore who is not an accredited investor, expert investor or an institutional investor (as defined in the Securities Futures Act), StoneX Financial Pte. Ltd. accepts legal responsibility to such persons for the contents of the report only to the extent required by law. Singapore recipients should contact StoneX Financial Pte. Ltd. at 6826 9988 for matters arising from, or in connection with the report.
In the case of all other recipients of this report, to the extent permitted by applicable laws and regulations neither StoneX Financial Pte. Ltd. nor its associated companies will be responsible or liable for any loss or damage incurred arising out of, or in connection with, any use of the information contained in this report and all such liability is hereby expressly disclaimed. No representation or warranty is made, express or implied, that the content of this report is complete or accurate.
StoneX Financial Pte. Ltd. is not under any obligation to update this report.
Trading CFDs carries a high level of risk that may not be suitable for some investors. Consider your investment objectives, level of experience, financial resources, risk appetite and other relevant circumstances carefully. The possibility exists that you could lose some or all of your investments, including your initial deposits. If in doubt, please seek independent expert advice. Visit www.forex.com/en-sg/terms-and-policies for the complete Risk Disclosure Statement.