





Dollar analysis: EUR/USD, GBP/USD, AUD/USD outlook – Forex Friday
Welcome to another edition of Forex Friday, a weekly report in which we discuss selected currency themes mainly from a macro viewpoint, but we also throw in a pinch of technical analysis here and there. In this week’s report, we will discuss a couple of dollar pairs and look forward to next week’s key events affecting the currency markets.
Share this:

- Dollar analysis: Greenback rebounds from oversold levels
- EUR/USD outlook: Is the euro heading to $1.15?
- GBP/USD outlook: All eyes on inflation report
- AUD/USD outlook: Chinese GDP and Australian jobs report eyed
Welcome to another edition of Forex Friday, a weekly report in which we discuss selected currency themes mainly from a macro viewpoint, but we also throw in a pinch of technical analysis here and there. In this week’s report, we will discuss a couple of dollar pairs and look forward to next week’s key events..
Dollar analysis: Greenback rebounds from oversold levels
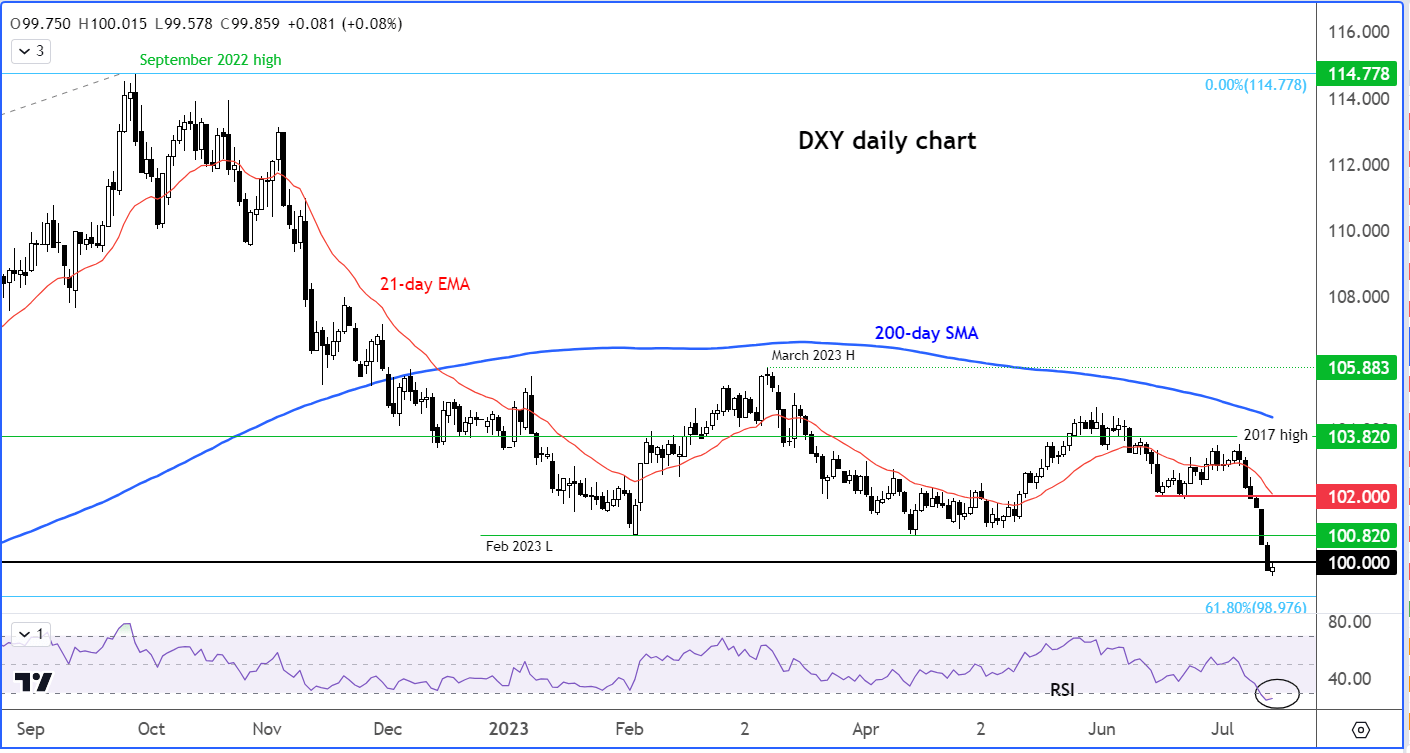
The US dollar has had a terrible week, allowing the major currency pairs, indices, gold and oil to rally. The narrative that the Federal Reserve is winning the fight against inflation got a boost as both CPI and PPI came in weaker than expected. This caused the US Dollar Index to fall below 100. On Friday morning, though, the dollar was finding some love – but only because of the lack of any fresh news, which encouraged traders to book some profit. In the afternoon, we saw the release of the UoM consumer sentiment and inflation expectations indices, which came out higher than expected. The 1-year Inflation Expectations printed 3.4% vs. 3.1% expected, which would suggest inflation could remain sticky, requiring the contractionary monetary policy to be in place longer. So, we saw the likes of the USD/JPY bounce back and this caused the Dollar Index to edge higher.
Clearly, the dollar is oversold, as indicated for example by the RSI indicator moving below the ‘oversold’ threshold of 30 on the daily time frame.
With the dollar making lower lows, the path of least resistance is clearly to the downside and so we may well see previous support levels turn into resistance in the future. For the dollar to turn positive, it will have to create a higher high first. We will cross that bridge if and when we get there. For now, let’s see what it will do around 100.00. Resistance is seen around 100.82, the low that was formed in February. Above that, 102.00 would be the next big level to watch for resistance.
GBP/USD outlook: All eyes on inflation report
Already finding support from weakening US dollar, the GBP/USD advanced beyond 1.31 on the back of stronger UK data, showing the economy shrunk in May by 0.1% instead of 0.3% expected by economists. The UK economy may now grow modestly in the coming months, finding support from the improving real wages and given that energy bulls are slightly lower. Higher mortgage rates will hold growth back, which is something that could impact the long-term GBP/USD outlook and weigh on other pound crosses. For now, the path of least resistance is to the upside for the cable and other pound crosses.
Pound traders’ focus will turn to inflation data next Wednesday after we had higher-than-expected rise in wages this week. The Bank of England will mostly likely hike rates further at its next meeting on August 3 – the size of which could be determined by the upcoming inflation data. See below for more.
EUR/USD outlook: Is the euro heading to $1.15?
The prospects of one final rate hike from the Fed plus at least two more from the ECB is what is helping to drive the EUR/USD. The tightening of rate differentials between the US and Eurozone should keep the EUR/USD supported on the dips. A move towards 1.15 is potentially underway.
The EUR/USD outlook remains positive heading into the weekend. The explosive breakout we have seen over the past couple of days suggests the EUR/USD bulls will likely remain in control of price action for a while yet, especially as the long-term trend is also bullish – look no further than the slope of the 200-day moving average.
Interestingly, there’s a Fibonacci-based price action in the making, namely a hormonic Butterfly – see the annotation on the chart. With price points X, A, B and C already established, the key question is where will point “D” occur. This is usually where price finds resistance and turns lows. Fibonacci extension levels can be our guide. The 127.2% extension of the BC leg comes in at 1.1220. But given the sharper move in this CD leg compared to the AB wave, I would expect the CD leg to be bigger than the AB leg. Thus, a continuation towards the 161.8% Fibonacci extension level at 1.1380 is where I would be looking for the EUR/USD to potentially form at least a temporary top.
Meanwhile, the long-term 61.8% Fibonacci retracement level against the drop from the 2021 high comes in at 1.1275.
In terms of support, Wednesday’s high at 1.1140 is now very important to hold insofar as the short-term EUR/USD outlook is concerned. If that breaks, then the April high at 1.1095 will be the next level to potentially provide support or else we will see a revisit of the more significant support around the 1.10 handle.
AUD/USD outlook: Chinese GDP and Australian jobs report eyed
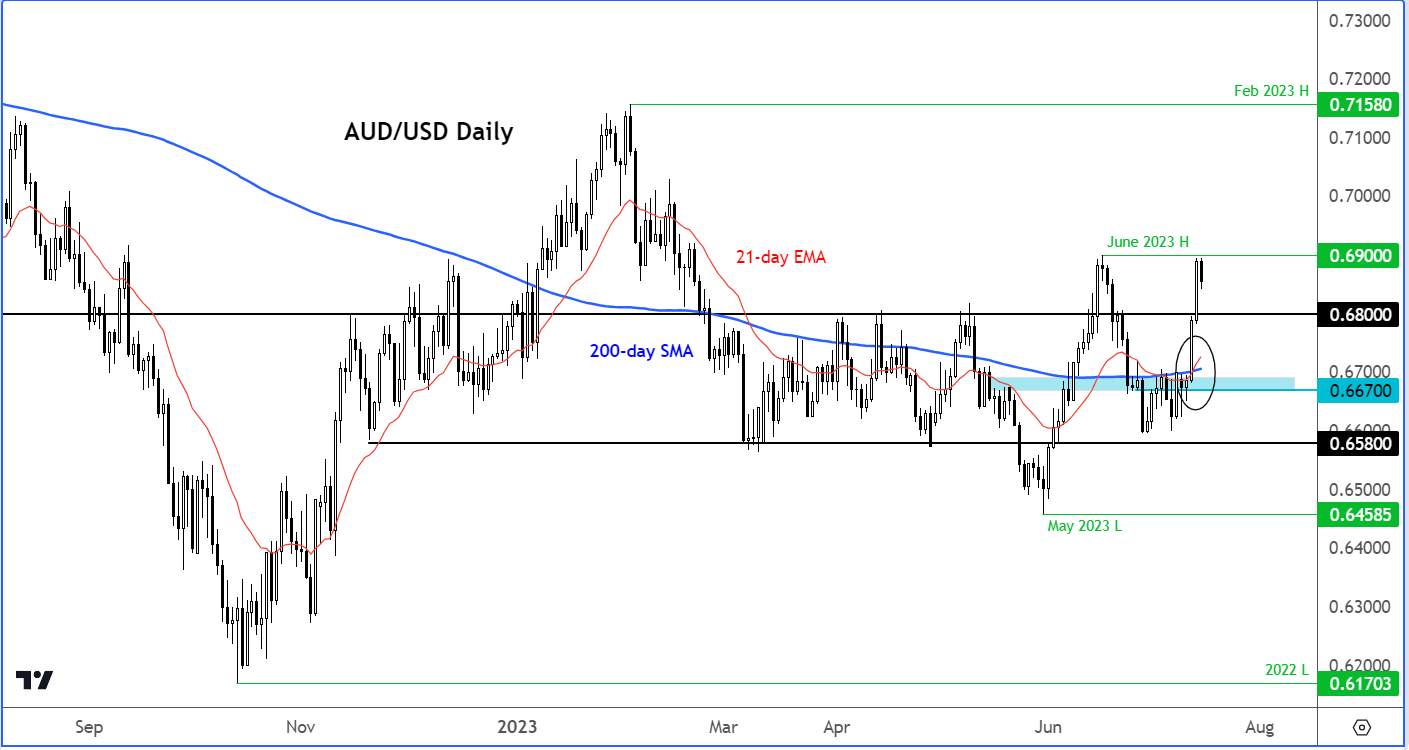
For commodity dollars, the most important event next week is likely to be the data dump from China on Monday. The world’s second largest economy has not been doing very well lately, which explains why the Chinese stock markets and yuan have been among the weakest in their respective fields. This has also held the likes of the AUD and NZD back. Both of these currencies should move in the direction of surprise in Chinese data next week. The AUD/USD outlook could also be influenced by Australia’s employment report, due on Thursday.
Retail sales aside, the economic calendar is void of any major US data next week, which should allow the US dollar to potentially make a small recovery after a bruising week. There will be lots of company earnings, though, that could drive market sentiment, until central banks are in focus again the following week.
For the AUD/USD, the key support level is around 0.6800 now, which was previously a pivotal level. In light of this week’s breakout, the bulls will not want to see rates go back below that level now.
Week ahead
China GDP
Monday, July 17
03:00 BST
The world’s second largest economy has not been doing very well lately, which explains why the Chinese stock markets and yuan have been among the weakest in their respective fields. We will find out exactly how China performed in Q2 after output had expanded by an above-forecast 4.5% in Q1 compared to the same period in 2022. We will also have the latest retail sales and industrial production figures release at the same time.
US Retail Sales
Tuesday, July 18
13:30 BST
Last week saw both CPI and PPI measures of inflation slow more than expected, raising the possibility that the Fed could pause rate hikes after one final hike in July. If we see retail sales data come in stronger, this will reinforce a goldilocks scenario of slowing prices and a resilient consumer, which should keep the bulls on Wall Street happy. But a weaker print could raise recession fears and undermine investor confidence.
UK CPI
Wednesday, July 19
07:00 BST
Pound traders’ focus will turn to inflation data on Wednesday after we had higher-than-expected rise in wages last week. The Bank of England will mostly likely hike rates further at its next meeting on August 3. The question is whether it will be 25- or another 50-bps hike. The latest inflation print will have a big say in that.
Source for all charts used in this article: TradingView.com
-- Written by Fawad Razaqzada, Market Analyst
Follow Fawad on Twitter @Trader_F_R
How to trade with City Index
You can trade with City Index by following these four easy steps:
- Open an account, or log in if you’re already a customer
• Open an account in the UK
• Open an account in Australia
• Open an account in Singapore
- Search for the company you want to trade in our award-winning platform
- Choose your position and size, and your stop and limit levels
- Place the trade
Forex analysis FAQs
How do I get the latest USD/CAD news?
You can get the latest USD/CAD news and price movements from our in-house team of experts.
Head to our news and analysis section for the most recent updates. Alternatively, you can access a live Reuters newsfeed on our trading platform.
Head to our news and analysis section for the most recent updates. Alternatively, you can access a live Reuters newsfeed through our trading platform.
When should I buy gold in forex?
You should always buy spot gold in forex markets (XAU/USD) when liquidity is higher, to ensure your position can be executed quickly and at the best price. Although FX markets trade 24 hours a day, five days a week, XAU/USD is most actively traded between 13:00 and 22:00 UTC (08:00 to 17:00 EST) when the New York market is open.
Learn more about gold forex trading
Learn more about gold forex trading
What’s the best strategy in gold forex?
Most gold forex strategies involve looking for support and resistance lines. That’s because XAU/USD tends to trade in a range, reaching previous highs or lows over time. So, by identifying these buy and sell points, traders can enter and exit trades that take advantage of the smaller oscillations between levels.
Discover the best trading strategies
Learn about strategies and risk
What is PPI in forex?
The Producer Price Index (PPI) is a measure of inflation, it tells us whether prices are rising or falling. As such, the PPI is an important metric for forex traders to look at, as a rising PPI could be a leading indicator of higher interest rates, which would boost a currency.
Learn about measuring inflation with the PPI
Learn more about the CPI and PPI in forex
Related tags:
Latest market news




Open an account in minutes
Experience award-winning platforms with fast and secure execution, and enjoy tight spreads from 0.5 pts on FX and 0.3 pts on indices.
Economic calendar
Web Trader platform
Our sophisticated web-based platform is packed with features.
Related articles
Gold outlook: XAU/USD hammered, stretched and vulnerable to a sharp rebound
Gold is getting hammered for solid fundamental reasons, but history suggests extreme four-hourly oversold conditions can produce violent countertrend rallies.
EUR/USD, USD/JPY Outlook: Oil, yields and an FX identity crisis
Crude oil is setting the tone across rates and FX, leaving EUR/USD vulnerable and USD/JPY caught between higher Treasury yields and the growing threat of intervention
AUD/USD Analysis: What's Next for the Australian Dollar After the RBA Decision?
Recent trading sessions have reflected a more neutral tone around the Australian dollar. This can be seen in AUD/USD price action, which has posted moves of roughly 0.2% over the last two sessions without establishing a clear direction. Much of this lack of momentum is linked to expectations surrounding the next policy moves from both the Reserve Bank of Australia (RBA) and the Federal Reserve.

This report is intended for general circulation only. It should not be construed as a recommendation, or an offer (or solicitation of an offer) to buy or sell any financial products. The information provided does not take into account your specific investment objectives, financial situation or particular needs. Before you act on any recommendation that may be contained in this report, independent advice ought to be sought from a financial adviser regarding the suitability of the investment product, taking into account your specific investment objectives, financial situation or particular needs.
StoneX Financial Pte. Ltd., may distribute reports produced by its respective foreign entities or affiliates within the StoneX group of companies or third parties pursuant to an arrangement under Regulation 32C of the Financial Advisers Regulations. Where the report is distributed to a person in Singapore who is not an accredited investor, expert investor or an institutional investor (as defined in the Securities Futures Act), StoneX Financial Pte. Ltd. accepts legal responsibility to such persons for the contents of the report only to the extent required by law. Singapore recipients should contact StoneX Financial Pte. Ltd. at 6826 9988 for matters arising from, or in connection with the report.
In the case of all other recipients of this report, to the extent permitted by applicable laws and regulations neither StoneX Financial Pte. Ltd. nor its associated companies will be responsible or liable for any loss or damage incurred arising out of, or in connection with, any use of the information contained in this report and all such liability is hereby expressly disclaimed. No representation or warranty is made, express or implied, that the content of this report is complete or accurate.
StoneX Financial Pte. Ltd. is not under any obligation to update this report.
Trading CFDs carries a high level of risk that may not be suitable for some investors. Consider your investment objectives, level of experience, financial resources, risk appetite and other relevant circumstances carefully. The possibility exists that you could lose some or all of your investments, including your initial deposits. If in doubt, please seek independent expert advice. Visit www.forex.com/en-sg/terms-and-policies for the complete Risk Disclosure Statement.