




Euro Technical Analysis: EUR/USD Weekly Shooting Star at 1.1500
EUR/USD has gained more than 12% from the January lows, and a shooting star on the weekly combined with overbought RSI make for an interesting backdrop.
Share this:

Euro, EUR/USD Talking Points:
- EUR/USD remains elevated and the weekly chart remains in overbought territory, and that’s the first such test via RSI since the summer of 2020.
- While that resistance is clear, bears have had an open door to prod a pullback for a few weeks now and haven’t yet been able to. The big question now is whether the USD can force a larger pullback, which can drive a similar mirror image theme in EUR/USD.
- I’ll be looking at both markets front-and-center in tomorrow’s webinar: Click here for registration information.
While the USD retains some attractive longer-term technical context, the backdrop in EUR/USD is shorter-term in nature. The pair has posed an impressive rally of more than 12% off the year’s lows, and for a non-levered currency pair that’s an impressive move in a little more than three months. Perhaps most interesting has been the sentiment surrounding it, as the Euro seemed extremely weak coming into the New Year and more recently, it’s been the USD that’s been getting hammered.
Realistically, it’s probably best for both economies for the currencies and the pair to retain a degree of stability, like what showed in 2023 and for most of 2024. When we do have an imbalance, and a massive trend in one, the other can feel some dramatic repercussions of that. In 2022 as the Fed continued to hike rates even with the European Central Bank remaining cautious, the U.S., in essence, exported their inflation to Europe.
At this point, EUR/USD is holding resistance at a key area on the chart around the 1.1500 psychological level. Last week was the first red bar in more than a month, and the overbought condition on the weekly remains in place. While that doesn’t necessarily mean automatic reversal, it does make the prospect of chasing breakouts beyond the 1.1500 level as a more challenging scenario.
That weekly bar also takes on the form of a shooting star formation, which is often approached with aim of topping patterns or in front of bearish reversals. So for sellers looking into short-side swings, there could be some context to work off of if the market continues to build on that backdrop.
EUR/USD Weekly Price Chart
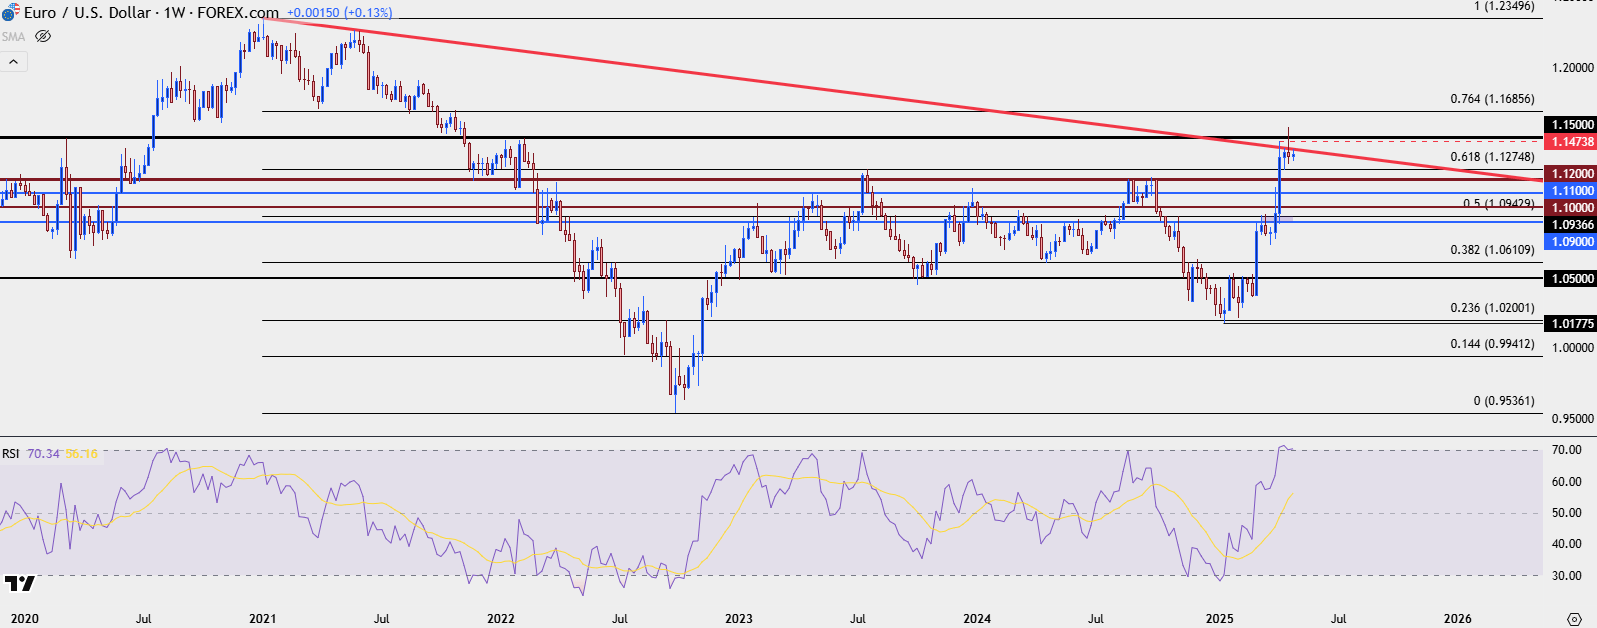 Chart prepared by James Stanley; data derived from Tradingview
EUR/USD Directional Dilemmas
As mentioned above, RSI being in overbought on the weekly doesn’t mean that price has to fall. And we can look at the prior episode of overbought RSI on the weekly back in 2020 to see that the pair didn’t top then as it rose to another fresh high five months later.
So, at this point I wouldn’t want to assume bearish control just yet as bulls have continued to bid support, even with price near this area of longer-term resistance.
On that front, there was strong defense of the 1.1275 level two weeks ago, and that led to a higher-low last week. In the event of a deeper pullback, the 1.1200 level is still of interest as this was the highs in 2024 on two separate occasions and since the breakout earlier in April, it hasn’t yet come in as support. Even the 1.1100 level could have claim as higher-low support on a bigger picture basis; and I’d be careful of getting optimistic about reversal scenarios until sellers were able to start testing below the 1.1000 psychological level again.
The 200-day moving average projects below 1.0800 still, which illustrates just how quickly this bullish move has come on. That level was the higher-low in late-March so it helps to put into context just how aggressively bulls pushed in early-April.
EUR/USD Daily Price Chart
 Chart prepared by James Stanley; data derived from Tradingview
--- written by James Stanley, Senior Strategist
Euro, EUR/USD Talking Points:
- EUR/USD remains elevated and the weekly chart remains in overbought territory, and that’s the first such test via RSI since the summer of 2020.
- While that resistance is clear, bears have had an open door to prod a pullback for a few weeks now and haven’t yet been able to. The big question now is whether the USD can force a larger pullback, which can drive a similar mirror image theme in EUR/USD.
- I’ll be looking at both markets front-and-center in tomorrow’s webinar: Click here for registration information.
While the USD retains some attractive longer-term technical context, the backdrop in EUR/USD is shorter-term in nature. The pair has posed an impressive rally of more than 12% off the year’s lows, and for a non-levered currency pair that’s an impressive move in a little more than three months. Perhaps most interesting has been the sentiment surrounding it, as the Euro seemed extremely weak coming into the New Year and more recently, it’s been the USD that’s been getting hammered.
Realistically, it’s probably best for both economies for the currencies and the pair to retain a degree of stability, like what showed in 2023 and for most of 2024. When we do have an imbalance, and a massive trend in one, the other can feel some dramatic repercussions of that. In 2022 as the Fed continued to hike rates even with the European Central Bank remaining cautious, the U.S., in essence, exported their inflation to Europe.
At this point, EUR/USD is holding resistance at a key area on the chart around the 1.1500 psychological level. Last week was the first red bar in more than a month, and the overbought condition on the weekly remains in place. While that doesn’t necessarily mean automatic reversal, it does make the prospect of chasing breakouts beyond the 1.1500 level as a more challenging scenario.
That weekly bar also takes on the form of a shooting star formation, which is often approached with aim of topping patterns or in front of bearish reversals. So for sellers looking into short-side swings, there could be some context to work off of if the market continues to build on that backdrop.
EUR/USD Weekly Price Chart
Chart prepared by James Stanley; data derived from Tradingview
EUR/USD Directional Dilemmas
As mentioned above, RSI being in overbought on the weekly doesn’t mean that price has to fall. And we can look at the prior episode of overbought RSI on the weekly back in 2020 to see that the pair didn’t top then as it rose to another fresh high five months later.
So, at this point I wouldn’t want to assume bearish control just yet as bulls have continued to bid support, even with price near this area of longer-term resistance.
On that front, there was strong defense of the 1.1275 level two weeks ago, and that led to a higher-low last week. In the event of a deeper pullback, the 1.1200 level is still of interest as this was the highs in 2024 on two separate occasions and since the breakout earlier in April, it hasn’t yet come in as support. Even the 1.1100 level could have claim as higher-low support on a bigger picture basis; and I’d be careful of getting optimistic about reversal scenarios until sellers were able to start testing below the 1.1000 psychological level again.
The 200-day moving average projects below 1.0800 still, which illustrates just how quickly this bullish move has come on. That level was the higher-low in late-March so it helps to put into context just how aggressively bulls pushed in early-April.
EUR/USD Daily Price Chart
Chart prepared by James Stanley; data derived from Tradingview
--- written by James Stanley, Senior Strategist
Related tags:
Latest market news




Open an account in minutes
Experience award-winning platforms with fast and secure execution, and enjoy tight spreads from 0.5 pts on FX and 0.3 pts on indices.
Economic calendar
Web Trader platform
Our sophisticated web-based platform is packed with features.
Related articles
EUR/USD, USD/JPY Outlook: Oil, yields and an FX identity crisis
Crude oil is setting the tone across rates and FX, leaving EUR/USD vulnerable and USD/JPY caught between higher Treasury yields and the growing threat of intervention
USD into a Massive Week as Yields Fly and Gold Breaks
It’s a huge week with PCE and NFP, but it’s what’s happening off of the calendar that demands attention with US yields flying to fresh multi-decade highs.

US Dollar Bulls Return as Euro and Pound Shorts Build | COT Report
US dollar net-longs surged at their fastest pace in seven years as futures traders added bearish exposure to the euro and British pound.

This report is intended for general circulation only. It should not be construed as a recommendation, or an offer (or solicitation of an offer) to buy or sell any financial products. The information provided does not take into account your specific investment objectives, financial situation or particular needs. Before you act on any recommendation that may be contained in this report, independent advice ought to be sought from a financial adviser regarding the suitability of the investment product, taking into account your specific investment objectives, financial situation or particular needs.
StoneX Financial Pte. Ltd., may distribute reports produced by its respective foreign entities or affiliates within the StoneX group of companies or third parties pursuant to an arrangement under Regulation 32C of the Financial Advisers Regulations. Where the report is distributed to a person in Singapore who is not an accredited investor, expert investor or an institutional investor (as defined in the Securities Futures Act), StoneX Financial Pte. Ltd. accepts legal responsibility to such persons for the contents of the report only to the extent required by law. Singapore recipients should contact StoneX Financial Pte. Ltd. at 6826 9988 for matters arising from, or in connection with the report.
In the case of all other recipients of this report, to the extent permitted by applicable laws and regulations neither StoneX Financial Pte. Ltd. nor its associated companies will be responsible or liable for any loss or damage incurred arising out of, or in connection with, any use of the information contained in this report and all such liability is hereby expressly disclaimed. No representation or warranty is made, express or implied, that the content of this report is complete or accurate.
StoneX Financial Pte. Ltd. is not under any obligation to update this report.
Trading CFDs carries a high level of risk that may not be suitable for some investors. Consider your investment objectives, level of experience, financial resources, risk appetite and other relevant circumstances carefully. The possibility exists that you could lose some or all of your investments, including your initial deposits. If in doubt, please seek independent expert advice. Visit www.forex.com/en-sg/terms-and-policies for the complete Risk Disclosure Statement.